


MT4 Forex Trend Robot Free produced one of those backtests that deserves a second look rather than immediate trust. On EURUSD H1 from January 2012 to May 2023, the MT4 Strategy Tester recorded 180 trades, all 180 closed in profit, with $5,632.88 net profit from a $1,000 starting balance and a reported maximum drawdown of 0.82%.
We therefore went beyond the headline statistics. We reconstructed the full EURUSD trade history, analysed trade duration and stop-loss behaviour, compared the result across five currency pairs, and checked our own monitored demo account. That deeper evidence changes the interpretation: every EURUSD position opened with no initial stop loss or take profit, the median trade lasted 19.74 days, and the first stop was typically added only much later. The later Myfxbook demo monitoring also failed to reproduce the near-perfect historical result, showing a -4.84% gain and 13.85% drawdown at its last update in March 2024.
This does not prove that the EA is unusable, fraudulent, or incapable of profitable periods. It does show why a 100% closed-trade win rate should not be treated as proof of forecasting accuracy, low risk, or live robustness.
Last updated: September 2026. This review combines original MT4 Strategy Tester reports, a full EURUSD trade-history reconstruction, QuantAnalyzer-derived closed-trade analysis, and EA ForexLab’s monitored Myfxbook demo account.
Key takeaways
- Backtest: EURUSD recorded 180/180 profitable closed trades from 2012 to 2023, with $5,632.88 net profit and 99.90% modelling quality.
- Trade structure: all 180 EURUSD trades opened with SL = 0 and TP = 0. In 174 of the 179 trades that later received a stop, the first recorded stop was already on the profitable side of entry.
- Long exposure: median trade duration was 19.74 days, mean duration 23.50 days, and the longest trade lasted 97.22 days.
- Profit concentration: trades held longer than 16 days represented 59.4% of EURUSD trades but produced about 74.7% of total EURUSD profit.
- Cross-pair risk: USDCHF produced a 16.56% maximum drawdown, far above EURUSD, despite retaining a 98.27% closed win rate.
- Forward evidence: EA ForexLab’s Darwinex demo monitoring on Myfxbook later showed -4.84% gain, 13.85% drawdown and 226 trades at the last update on 22 March 2024.
- Execution behaviour: the EURUSD report contains 40,036 OrderModify events for 180 trades, making stop-management behaviour an important part of any live/forward verification.
- Evidence gap: the Myfxbook monitoring stopped updating in March 2024, and we found no newer verified monitoring through September 2026.
What we tested
The tested file identifies itself as MT4 Forex Trend Robot Free, version 1.0. The copy originally reviewed by EA ForexLab was distributed free through a YouTube channel rather than through a formal marketplace listing. We cannot confirm a named developer or whether copies circulating today are identical to the file tested in 2023.
The primary EURUSD test ran in MetaTrader 4 build 1380 on H1 from 2 January 2012 to 4 May 2023. Historical prices were supplied from Dukascopy through Tick Data Suite with variable spread. The report modelled 260,252,365 ticks at 99.90% quality with zero chart-mismatch errors. The MT4 terminal was connected to an IC Markets demo server, but that server name is the terminal environment, not the historical tick-data source. Slippage was not modelled.
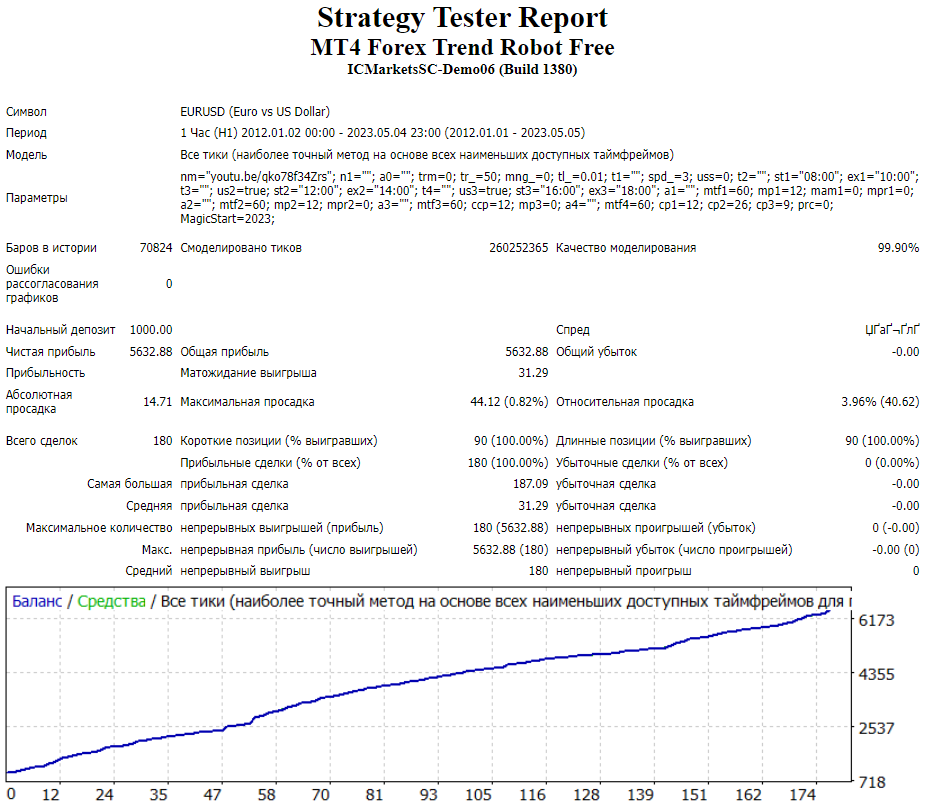
Position size remained fixed at 0.01 lot in the EURUSD test. The parameter set also shows three entry windows — approximately 08:00–10:00, 12:00–14:00 and 16:00–18:00 server time — so this is not an around-the-clock entry system. The tester chart displays MACD (12,26,9), CCI (12) and RSI (12), but without source code we cannot determine exactly how, or whether, each indicator participates in the internal decision logic.
| Metric | Value |
|---|---|
| EA / version | MT4 Forex Trend Robot Free, v1.0 |
| Platform | MetaTrader 4, build 1380 |
| Primary test pair | EURUSD |
| Other supplied pairs | GBPUSD, USDCAD, USDCHF, USDJPY |
| Timeframe | H1 |
| Test period | 2 Jan 2012 – 4 May 2023 |
| Tick data | Dukascopy via Tick Data Suite |
| Spread | Variable / historical |
| Slippage | Not modelled |
| Modelling quality | 99.90% on EURUSD |
| Modelled ticks | 260,252,365 |
| Chart mismatch errors | 0 |
| Initial deposit | $1,000 |
| Position size | Fixed 0.01 lot |
| Initial SL / TP | 0 / 0 |
| Entry windows | ≈08:00–10:00; 12:00–14:00; 16:00–18:00 server time |
| Tester-chart indicators | MACD (12,26,9); CCI (12); RSI (12) |
| Distribution source | Free copy distributed via YouTube channel |
Backtest results by currency pair
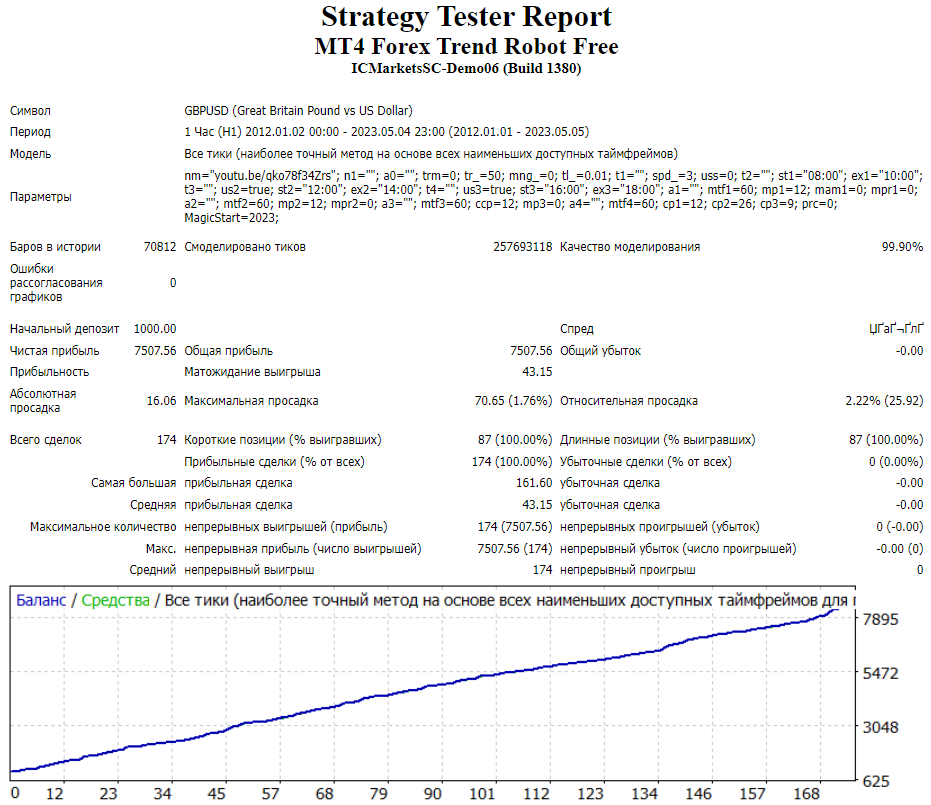
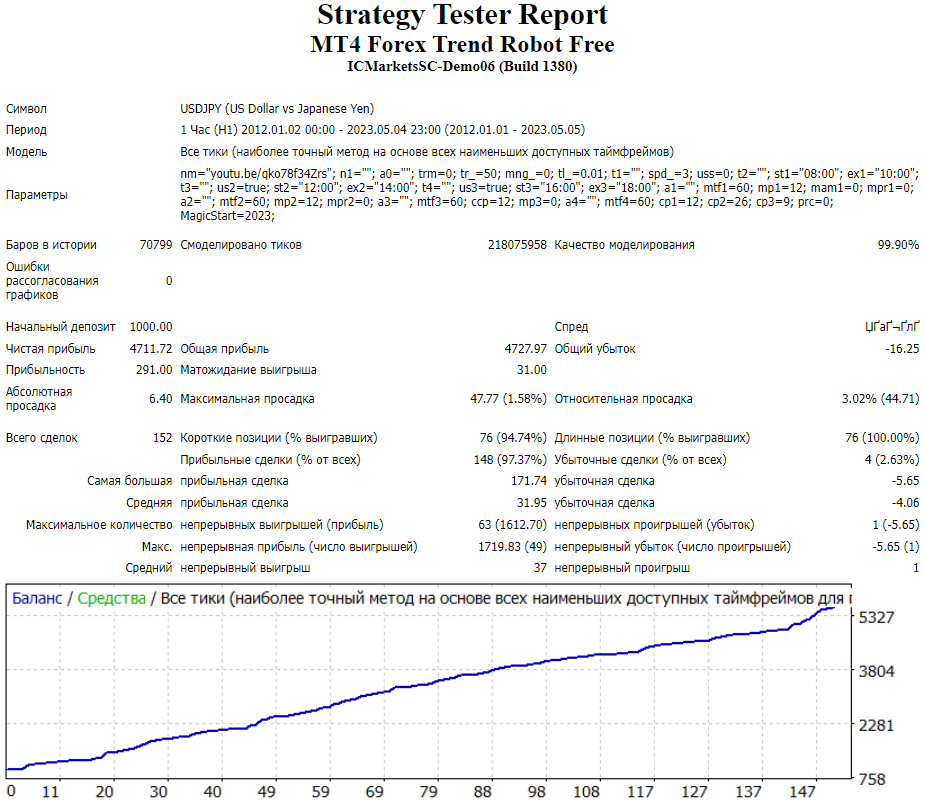
The supplied MT4 reports cover EURUSD, GBPUSD, USDCAD, USDCHF and USDJPY. Three pairs closed without a single losing trade. USDCHF and USDJPY did record losses, although their closed win rates remained extremely high.

| Pair | Trades | Closed win rate | Net profit | Maximum drawdown | Relative drawdown | Profit Factor | Largest closed loss |
|---|---|---|---|---|---|---|---|
| EURUSD | 180 | 100% (180/180) | +$5,632.88 | $44.12 (0.82%) | 3.96% ($40.62) | n/a — zero gross loss | None |
| GBPUSD | 174 | 100% (174/174) | +$7,507.56 | $70.65 (1.76%) | 2.22% ($25.92) | n/a — zero gross loss | None |
| USDCAD | 174 | 100% (174/174) | +$4,422.09 | $32.02 (1.54%) | 1.54% ($16.67) | n/a — zero gross loss | None |
| USDCHF | 173 | 98.27% (170/173) | +$4,617.86 | $397.98 (16.56%) | 16.56% ($397.98) | 161.70 | -$20.41 |
| USDJPY | 152 | 97.37% (148/152) | +$4,711.72 | $47.77 (1.58%) | 3.02% ($44.71) | 291.00 | -$5.65 |
Profit Factor needs special care here. On EURUSD, GBPUSD and USDCAD, gross loss is zero, so Profit Factor is not a meaningful finite statistic. Calling it “infinite” would make the result sound stronger while adding no information. On USDCHF and USDJPY, Profit Factor is technically defined, but the values are extremely large because gross loss is very small.
Why the 100% win rate needs context
Win rate describes how closed trades finished. It does not tell us what happened to open equity while those trades were still active, how far positions moved against entry, or how long capital remained exposed before a trade eventually closed.
That distinction is central here. In the EURUSD sample, all 180 trades opened with no initial stop loss and no take profit. The positions were often held for weeks before a stop appeared. The result is therefore consistent with a trade-management process that gives losing or unresolved positions substantial time to recover before a profitable exit becomes possible. That observation changes the meaning of the 100% closed win rate; it does not prove the EA predicted market direction correctly 100% of the time.
How the EA managed EURUSD trades in the historical test
The points below describe observable behaviour from the order history. Where we infer a possible mechanism, we label it as interpretation rather than confirmed internal logic.
No predefined price-based loss cap at entry
Every EURUSD position opened with Stop Loss = 0 and Take Profit = 0. That means there was no predefined price-based protective exit at the moment of entry. This is important because a closed-trade win rate can look exceptionally clean when losing positions are allowed to remain open rather than being realised quickly.
Trades were held for weeks, not hours
The median EURUSD trade lasted 19.74 days. The mean was 23.50 days, and the maximum was 97.22 days. Long holding periods increase exposure to changes in volatility, macro events, weekend gaps, financing costs and market-regime changes.
The first stop usually appeared much later
The first recorded stop-loss modification arrived a median of 18.67 days after entry. In 174 of the 179 trades that eventually received a stop, that first stop was already on the profitable side of the original entry price. The median favourable distance was approximately 209 EURUSD pips.
After the first stop appeared, the median remaining time until exit was only about 17 hours. This makes the late stop placement a central part of the historical trade path rather than a minor implementation detail.
The trade history is consistent with profit protection after recovery
Putting those observations together, the EURUSD history is consistent with the following sequence: a position opens without an initial SL or TP, remains open for an extended period, later receives a stop after price has moved favourably, and then exits through that stop. Of the 180 trades, 179 eventually closed through a stop; the final trade was closed at the end of the test and was also profitable.
This sequence is strongly supported by the recorded orders. What we cannot prove from the ledger alone is the EA developer’s intended logic, the exact trigger for adding the stop, or whether other internal exit conditions existed but simply did not fire in this sample.
Opposite positions frequently overlapped
The direction of all 180 EURUSD trades alternated perfectly between sell and buy. In 156 of 180 entries, the next trade opened before the previous one had closed, and the new position was always in the opposite direction. Because both legs used 0.01 lot, this temporarily created equal-volume long/short overlap.
| Metric | Observed value |
|---|---|
| Total EURUSD trades | 180 (90 buy / 90 sell) |
| Closed losing trades | 0 |
| Initial SL / TP | 0 / 0 on all 180 entries |
| Trades that later received a stop | 179 |
| First stop already on profitable side | 174 of 179 |
| Median entry → first stop | 18.67 days |
| Mean entry → first stop | 22.33 days |
| Maximum entry → first stop | 93.67 days |
| Median favourable distance at first stop | ≈209 pips |
| Median first stop → exit | ≈17 hours |
| Trade duration median | 19.74 days |
| Trade duration mean | 23.50 days |
| Trade duration maximum | 97.22 days |
| OrderModify events | 40,036 |
| Opposite-direction overlaps | 156 of 180 entries |
| Median overlap | ≈7.75 hours |
| Maximum overlap | ≈79.8 hours |
Trade duration and profit concentration
The EURUSD backtest did not generate its profit evenly across short and long trades. The longer the positions were allowed to remain open, the larger their contribution became.

| Holding time | Trades | Profit | Share of EURUSD profit |
|---|---|---|---|
| ≤ 4 days | 3 | $49.85 | 0.9% |
| 4–8 days | 20 | $289.60 | 5.1% |
| 8–16 days | 50 | $1,085.95 | 19.3% |
| 16–30 days | 63 | $1,832.28 | 32.5% |
| > 30 days | 44 | $2,375.15 | 42.2% |
Trades held longer than 16 days accounted for 107 of 180 trades, or 59.4%, but produced approximately $4,207 of the $5,632.88 total EURUSD profit — about 74.7%.
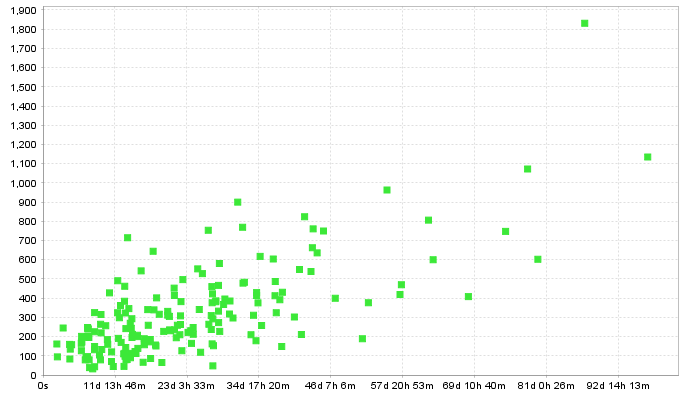
Long holding is therefore structural to this result. Any attempt to evaluate the EA using only final profit and closed win rate misses a major part of how the historical result was produced.
Drawdown: closed-trade curve versus intratrade risk
The supplied QuantAnalyzer chart rises almost continuously because nearly every closed EURUSD trade finished in profit. We use it here as a cumulative closed-trade curve, not as an independent mark-to-market equity series.
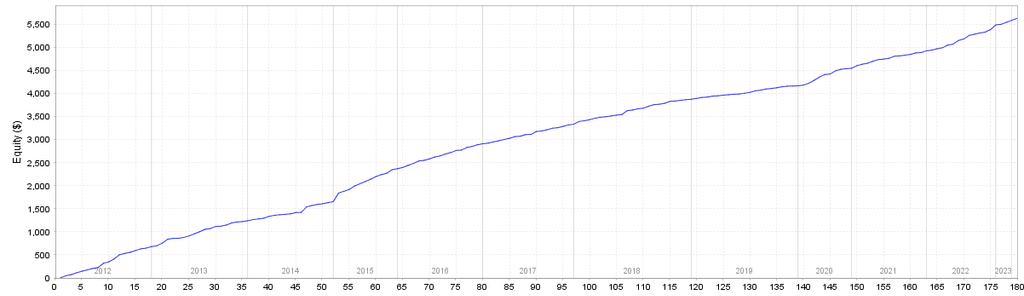
The MT4 Strategy Tester itself does report drawdown figures — for EURUSD, maximum drawdown of $44.12 (0.82%) and relative drawdown of 3.96% ($40.62). We are not claiming that the tester reported zero floating drawdown.
The limitation is different: a curve reconstructed from closed trades cannot independently show the maximum adverse excursion of each position while it was open. With no initial stop and multi-week holding periods, that intratrade path matters. We did not invent or estimate a maximum adverse excursion value because the supplied closed-trade history does not support one.
Why the USDCHF result matters
USDCHF is useful because it prevents the EURUSD result from being read as a universal risk profile. The USDCHF test still looked impressive on headline win rate — 170 winners and only three losers out of 173 trades — but its maximum drawdown reached 16.56%, versus 0.82% on EURUSD.
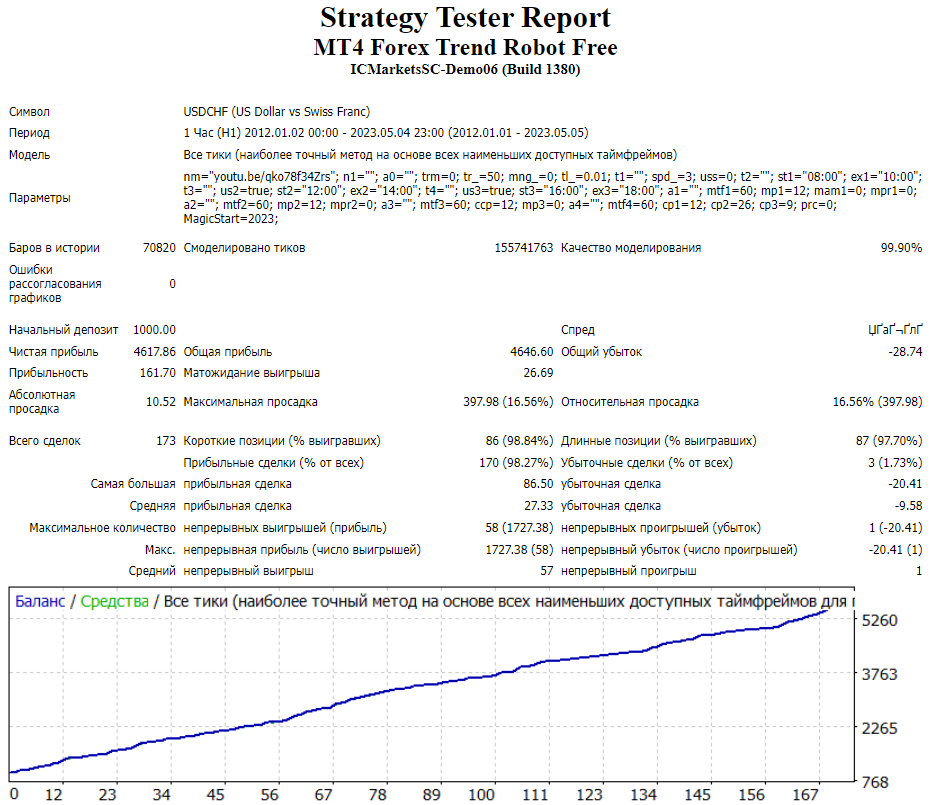
The correct conclusion is not that USDCHF “proves” the EA is risky. It is that risk was materially different across instruments. A trader looking only at the best-looking EURUSD, GBPUSD or USDCAD report would miss that variation.
The monitored demo forward test did not reproduce the backtest
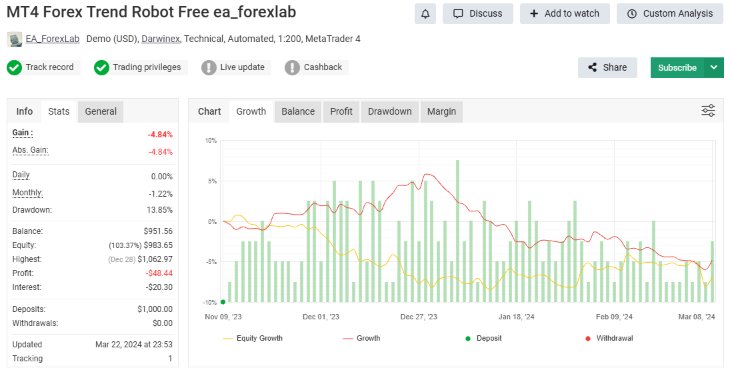
EA ForexLab also ran MT4 Forex Trend Robot Free on a Darwinex demo account monitored through Myfxbook. This gives us something more useful than another historical simulation: an out-of-sample, broker-connected record.
At the account’s last update on 22 March 2024, Myfxbook showed -4.84% gain, 13.85% drawdown, a $951.56 balance from a $1,000 deposit, and 226 trades. It also recorded -$12.01 in commissions and -$20.30 in interest. The account was demo, not real, and the monitoring is no longer current, so this record should not be treated as a definitive live verdict. But it is direct evidence that the near-perfect historical result did not transfer unchanged into forward trading conditions.
View the MT4 Forex Trend Robot Free Myfxbook monitoring:
| Metric | EURUSD historical backtest | EA ForexLab Myfxbook demo monitoring |
|---|---|---|
| Environment | MT4 Strategy Tester / TDS | Darwinex demo / MT4 / 1:200 |
| Evidence period | 2 Jan 2012 – 4 May 2023 | Broker-connected monitoring; last updated 22 Mar 2024 |
| Trades | 180 | 226 |
| Result | +$5,632.88 net on $1,000 initial deposit | -4.84% gain; balance $951.56 from $1,000 deposit |
| Reported drawdown | Max DD 0.82%; relative DD 3.96% | 13.85% Myfxbook drawdown |
| Commission | Not isolated in supplied report | -$12.01 |
| Interest / swap | Not isolated in supplied report | -$20.30 interest |
| Interpretation | Historical simulation | Forward/demo evidence; not directly like-for-like with the EURUSD backtest |
This comparison is not perfectly like-for-like. The EURUSD backtest covers one pair over 2012–2023, while the monitored demo account traded in a different period and across broker-connected market conditions. That difference means we cannot use the monitoring to identify a single cause of the divergence. It does, however, illustrate exactly why forward testing matters: historical robustness has to survive outside the tester.
OrderModify behaviour and Error 1
The EURUSD report contains 40,036 OrderModify events for only 180 trades — roughly 220 modifications per trade across the sample. The MT4 journal screenshot shows repeated near-identical stop modifications, sometimes several within the same second, together with occasional OrderModify error 1 messages.
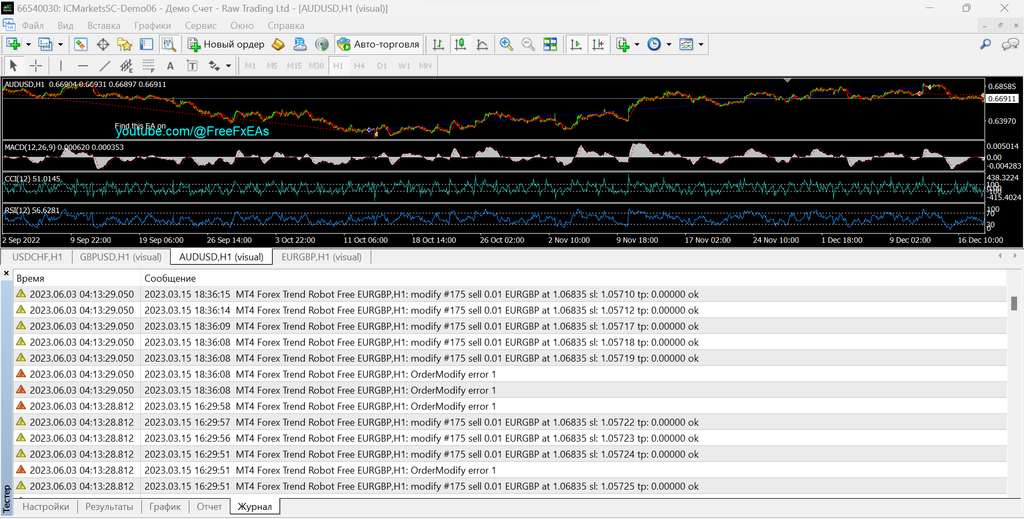
Error 1 should not be sensationalised. The official MQL4 OrderModify documentation states that unchanged parameters can generate Error 1 (ERR_NO_RESULT). The screenshot therefore does not prove a broker rejection or execution failure.
The volume of modifications is still relevant. Live trading introduces request handling, latency, broker stop/freeze levels and other server-side constraints that do not necessarily behave identically to the Strategy Tester. This is a reason to compare tester and forward execution, not a reason to claim the EA is technically broken.
Trading windows, not around the clock
The tested settings restrict entries to three daily windows — approximately 08:00–10:00, 12:00–14:00 and 16:00–18:00 server time. The EURUSD profit-by-entry-hour chart is consistent with those windows, with profit concentrated around 08:00, 12:00 and 16:00.

This corrects the older “around the clock” description. The exact GMT/DST interpretation is still unknown from the supplied report, so the windows should be described as server time unless the broker offset is independently confirmed.
What 99.90% modelling quality does — and does not — tell us
The 99.90% modelling-quality figure and zero chart-mismatch errors support the quality of the historical test setup. They tell us that the MT4 run used a high-quality tick simulation rather than a coarse generated-tick model.
They do not prove that the EA is robust, that its parameters were not fitted to the historical sample, or that future/demo/live trading will reproduce the same sequence. Data quality answers “how accurately was this historical scenario simulated?” It does not answer “will the strategy retain an edge outside that scenario?”
What the current evidence still cannot establish
- Current 2026 performance. The backtests end in May 2023 and the Myfxbook demo stopped updating in March 2024. We found no newer verified monitoring through September 2026.
- Maximum adverse excursion. The supplied closed-trade history does not provide a complete mark-to-market path for every open position, so we do not publish an invented MAE figure.
- Exact effect of every trading cost. Variable spread was included in the backtest and slippage was not modelled. The historical report does not give us enough information to isolate every commission/swap contribution. The forward account, however, did record both commission and interest costs.
- Exact internal entry/exit logic. We can observe orders and parameters but do not have source code.
- Version continuity. We cannot verify that files distributed today are identical to the version tested in 2023.
- Broker portability. Opposite-position overlap, server-time windows and frequent stop modifications mean account rules and broker infrastructure can affect behaviour.
What additional testing would be most useful
The strongest next step would be a fresh test from May 2023 through the latest reliable data using the same EA version, followed by a new monitored forward run under documented broker conditions. Because the historical result is unusually clean, we would also prioritise:
- maximum adverse excursion and floating-equity reconstruction where the required data are available;
- spread, commission, swap, slippage and execution-delay sensitivity;
- cross-broker tick-data comparison;
- parameter perturbation rather than testing only one fixed set;
- separate long/short and pair-by-pair behaviour;
- 28-year date-shift testing to check for unusual dependence on the original calendar structure.
These tests have not been performed for this updated review, so we do not present hypothetical results as evidence.
Conclusion
MT4 Forex Trend Robot Free has an unusually attractive historical record on several pairs. On EURUSD, the tester produced 180 profitable closed trades out of 180, and the closed-trade curve is exceptionally smooth. But the full trade history makes those headline numbers less straightforward than they first appear.
The EURUSD positions opened without an initial SL or TP, the median holding time was about 20 days, the first stop typically appeared only after most of that holding period had passed, and almost three quarters of total profit came from trades held longer than 16 days. USDCHF showed that the drawdown profile could be materially worse on another pair. Most importantly, EA ForexLab’s own monitored demo account later showed -4.84% gain and 13.85% drawdown rather than a continuation of the near-perfect backtest.
That does not justify a blanket positive or negative verdict. It gives a narrower and more useful conclusion: the backtest is technically interesting, but its 100% closed win rate is heavily shaped by trade-management behaviour and should not be treated as proof of predictive accuracy or future robustness. The available forward evidence is weaker than the historical test, and there is no current verified monitoring after March 2024.
EA ForexLab’s role is to document what was tested, how it behaved, and where the evidence stops. The decision to use any Expert Advisor on demo or live remains with the trader.
In order to download an adviser with tests, go to our telegram channel:
