


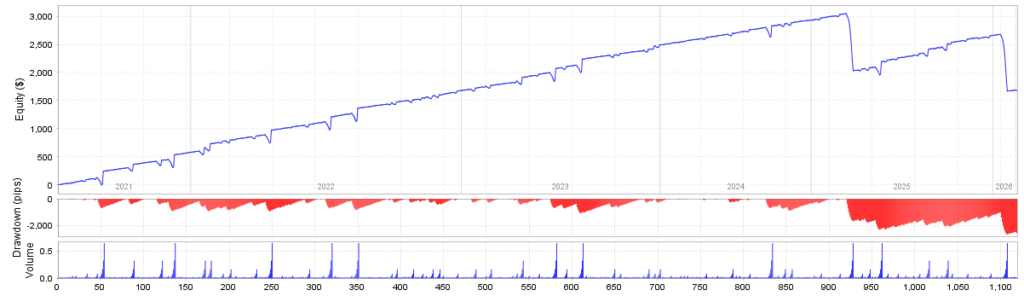
FXStabilizer has been marketed for years, and the vendor currently presents public trading records dating back to the mid-2010s, saying the system has traded live since 2015. The equity curve I was handed looked the part: a clean diagonal climb from $1,000 to nearly $3,000 over five years. A curve that smooth is worth opening up because recovery systems can look calm while risk accumulates inside open exposure. So I pulled the full MetaTrader 4 order history for FXStabilizer_EUR 1.2 and rebuilt the account trade by trade. The reconstruction changed how I read the smooth curve.
Key findings first
The test I examined is the FXStabilizer_EUR 1.2 configuration on EURUSD H1, run from January 2021 to February 2026 at 99.90% modelling quality from a $1,000 deposit. Every figure below reconciles against the raw order table.
- Net profit +$1,678.33, profit factor 1.36, position win rate 59.92%, relative drawdown 54.03%.
- The 756 executed positions reconstruct into 366 flat-to-flat cycles, and 362 of them closed positive. That 98.9% is the share of reconstructed flat-to-flat cycles that ended with positive displayed P/L, not a trade win rate, and the two answer different questions.
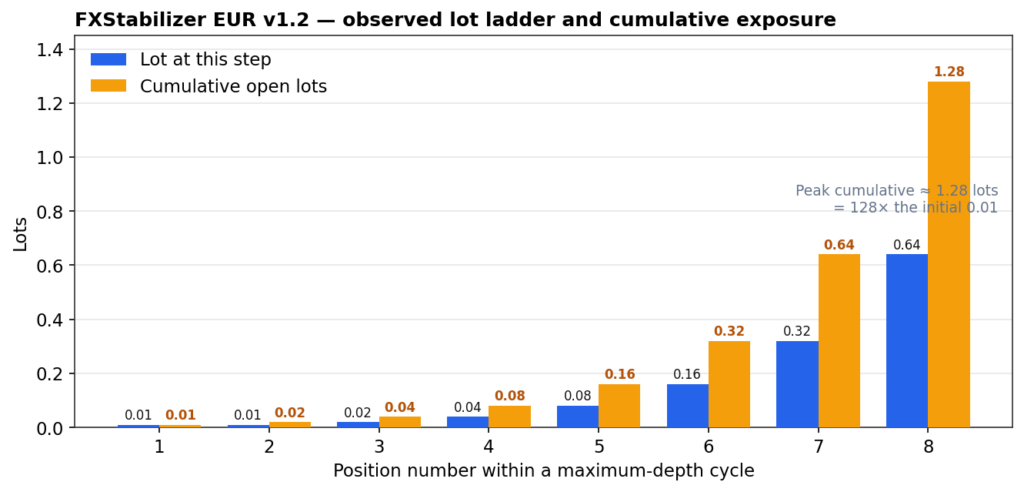
- The system recovers a losing position by adding same-direction trades. The first recovery entry stays at 0.01 lot; from the step after that the size doubles, up to 0.64, and cumulative open volume reaches about 1.28 lots at maximum depth.
- Only two cycles ever reached the maximum depth of eight positions. Both were SELL sequences, both were closed by a common stop, and each realised about −$1,013.
- Those two events account for roughly 99.6% of all negative cycle-level P/L, and they more than explain the only two negative years in the sample.
- The vendor’s live Myfxbook accounts share several aggregate traits with the tested run, but they do not establish that the same recovery logic was used, so I treat them as context rather than validation.
What I tested
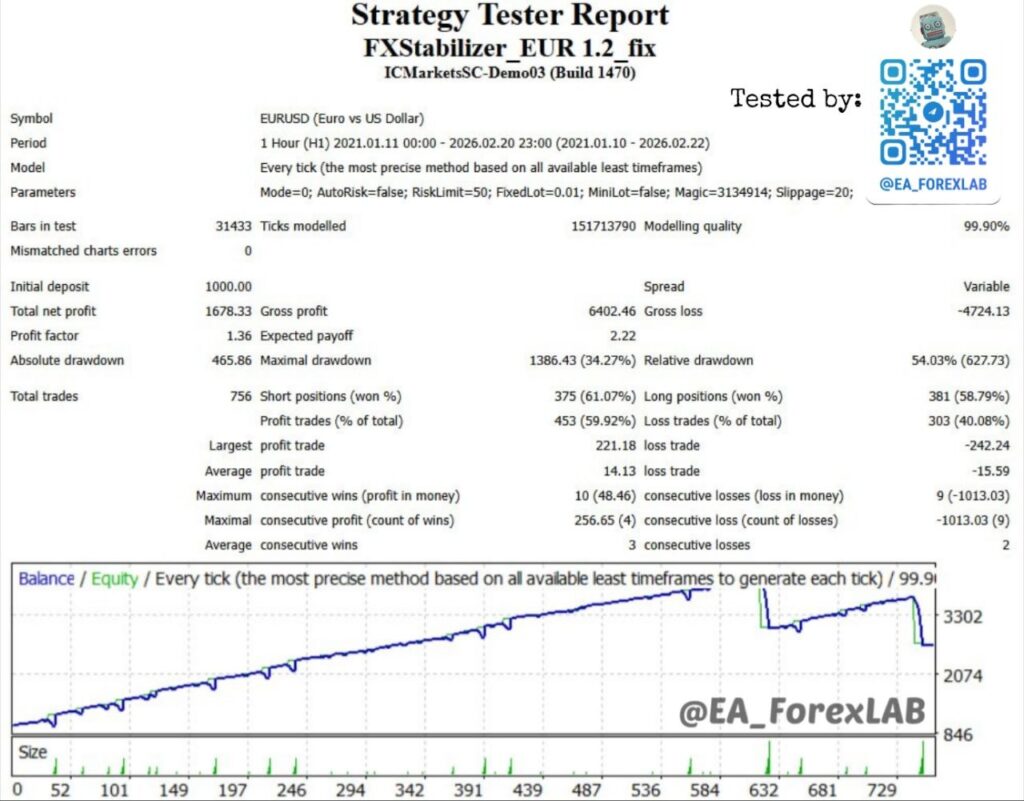
| Metric | Value |
|---|---|
| Expert / version | FXStabilizer_EUR 1.2_fix |
| Platform / server | MetaTrader 4 (ICMarketsSC-Demo03, Build 1470) |
| Symbol / timeframe | EURUSD / H1 |
| Test period | 2021.01.11 – 2026.02.20 |
| Model / quality | Every tick / 99.90% (0 mismatched-chart errors) |
| Parameters | Mode=0; AutoRisk=false; RiskLimit=50; FixedLot=0.01; Magic=3134914; Slippage=20 |
| Initial deposit / spread | $1,000 / Variable |
| Total net profit | +$1,678.33 |
| Gross profit / gross loss | $6,402.46 / −$4,724.13 |
| Profit factor | 1.36 |
| Expected payoff (after costs) | $2.22 |
| Total trades (executed positions) | 756 |
| Short / long won | 375 (61.07%) / 381 (58.79%) |
| Profit / loss trades | 453 (59.92%) / 303 (40.08%) |
| Average win / average loss | +$14.13 / −$15.59 |
| Break-even win rate / margin | 52.46% / +7.46 pp |
| Absolute drawdown | $465.86 |
| Maximal drawdown | $1,386.43 (34.27%) |
| Relative drawdown | 54.03% ($627.73) |
| Max consecutive losses | 9 (−$1,013.03) |
Before trusting any of the headline figures, I reconciled them against the order rows. Summing the profit on every closed trade gives $1,678.11, which is $0.22 short of the reported $1,678.33. The gap splits between gross profit (off by $0.13) and gross loss (off by $0.09), while the running balance column ends at exactly $2,678.33. The $0.22 difference is consistent with cumulative display rounding across the two-decimal trade rows, so I treat the MT4 headline and final balance as authoritative. Everything else ties out: profit factor 1.36, expected payoff $2.22, the 381 long and 375 short positions, the largest winner and loser.
Two things about the test itself shape how I read it. It is a simulation. The report uses Every Tick modelling, shows 99.90% modelling quality, zero mismatched-chart errors and variable spread, but it still cannot reproduce every feature of live execution. The input reading Slippage=20 is an EA parameter, not evidence that twenty points of realistic slippage were modelled. Anyone weighing a live deployment should keep our backtest testing methodology in mind here, because the gap between a clean tester run and real execution is exactly where recovery systems get tested. The expected payoff of $2.22 is already an after-cost number. The question worth asking is not whether costs erased it, but how the structure turned a fairly ordinary win rate into a positive expectancy at all.
What 756 trades actually represent
By direction the trade list looks unremarkable: 381 long, 375 short, winning 59.92% of the time, which reads like an even two-sided strategy. The headline win rate was not the part that interested me. Once I grouped the 756 positions into flat-to-flat exposure cycles, tracking account exposure from the first position of a sequence until every position in it closed and exposure returned to zero, the structure changed considerably. The 756 trades collapse into 366 cycles. Most ended at the first position. The deeper cycles explain most of the risk.
How a losing position becomes a recovery ladder
The order record lays out the mechanism. A cycle opens with a 0.01-lot market order and places a same-direction pending limit one step away, also at 0.01. If the first trade reaches its target, the pending is deleted and the cycle ends clean. If price runs against the position, that first recovery fills at 0.01, a new same-direction limit is placed one step deeper, and the take-profits of the open positions are pulled together toward a common basket exit. From that next step onward the added size doubles: 0.02, 0.04, 0.08, and so on. The sequence keeps adding until the basket closes in aggregate profit, which most of the time it does.
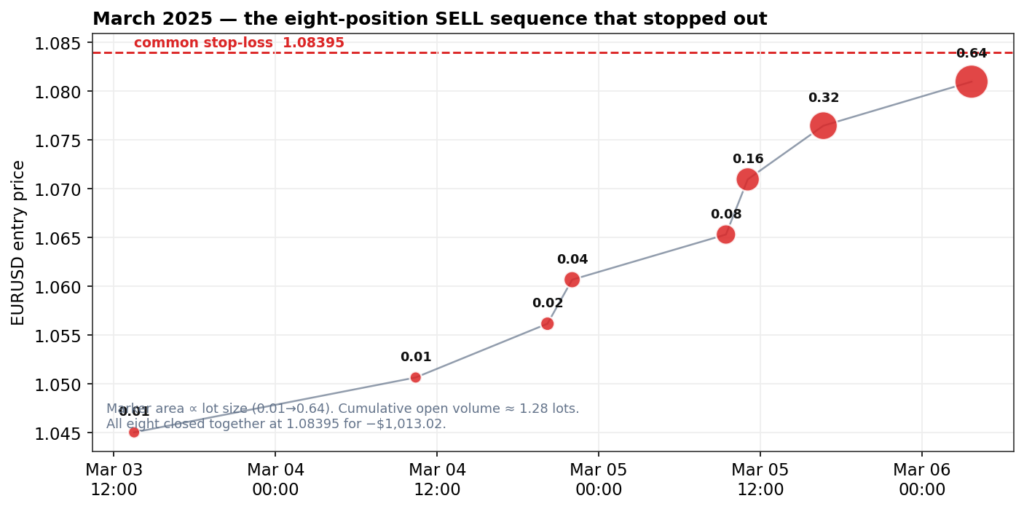
The size progression is where the exposure becomes obvious. The observed ladder runs 0.01, 0.01, 0.02, 0.04, 0.08, 0.16, 0.32, 0.64, and the size distribution across the whole test confirms it: 547 positions at 0.01 down to just two at 0.64. A cycle that reaches the eighth rung is holding about 1.28 lots in aggregate, roughly 128 times the initial entry. That figure is cumulative open volume rather than a risk multiplier, since the positions sit at different prices and the stops move, but it is the honest way to describe how far the exposure can stretch when a sequence runs to its limit.
Why 98.9% of cycles closing positive is not a 98.9% win rate
This is the distinction that reframes the test. At the position level, 40% of trades lose. At the cycle level, only four of 366 sequences finished negative, so 98.9% closed positive. Both numbers are correct, and they describe different things. The recovery structure folds individual losing legs into baskets that, once the converged take-profit triggers, close green overall. Calling 98.9% a win rate would blur two different units of analysis. It simply means that 362 of 366 reconstructed flat-to-flat cycles ended with positive displayed P/L. Of the four negative cycles, one small depth-three loss of $4.96 was created by the tester’s end-of-sample forced close rather than a normal strategy exit. The more important question is what happened in the genuinely failed recovery sequences.
Where the historical profit came from
Grouping the cycles by how deep they ran shows where the money was made and lost.
| Recovery depth | Cycles | Share | Net P/L | Positive | Negative | Max lot | Cumulative lots |
|---|---|---|---|---|---|---|---|
| 1 | 185 | 50.5% | +$997.04 | 185 | 0 | 0.01 | 0.01 |
| 2 | 94 | 25.7% | +$476.27 | 94 | 0 | 0.01 | 0.02 |
| 3 | 31 | 8.5% | +$300.01 | 29 | 2 | 0.02 | 0.04 |
| 4 | 21 | 5.7% | +$496.06 | 21 | 0 | 0.04 | 0.08 |
| 5 | 17 | 4.6% | +$249.21 | 17 | 0 | 0.08 | 0.16 |
| 6 | 7 | 1.9% | +$412.14 | 7 | 0 | 0.16 | 0.32 |
| 7 | 9 | 2.5% | +$771.69 | 9 | 0 | 0.32 | 0.64 |
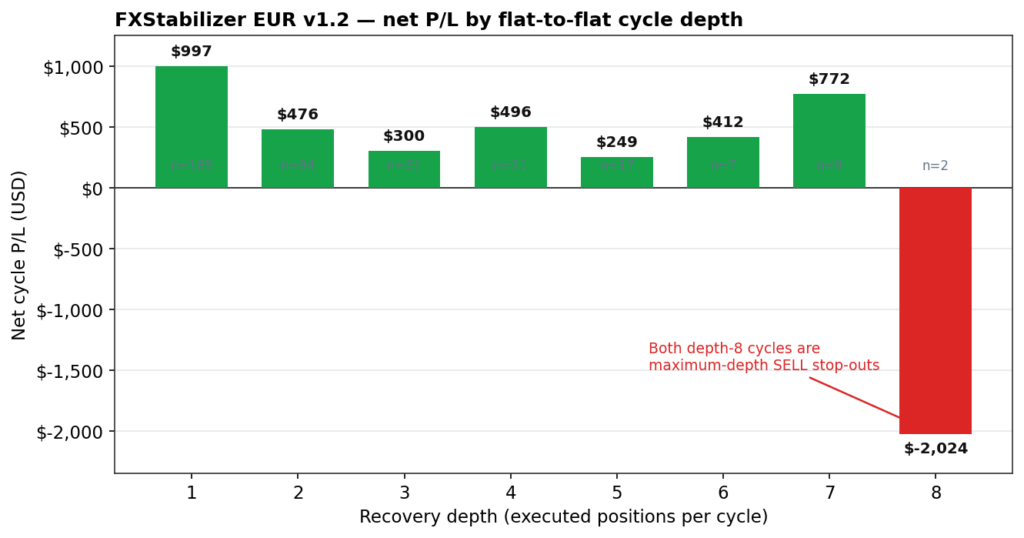
| 8 | 2 | 0.5% | −$2,024.31 | 0 | 2 | 0.64 | 1.28 |
| All cycles | 366 | 100% | +$1,678.11 | 362 | 4 | 0.64 | 1.28 |
More than half of the cycles ended at the first position, and progressively fewer reached the deeper recovery levels. The P/L distribution across depth is less intuitive. In this sample, cycles ending at depths one through seven were positive in aggregate, while the two cycles that reached depth eight lost about $2,024 combined. Almost all negative cycle-level P/L is concentrated in that final depth.
Long, short, and where the shortfall really sits
By direction the split is instructive. The 181 buy cycles netted about +$1,832, while the 185 sell cycles netted about −$154, which makes the short side look like the weak leg. Remove the two maximum-depth SELL failures, though, and the remaining 183 short cycles made roughly +$1,870. Two sequences were large enough to turn the whole short-side result from strongly positive to slightly negative. This is a concentration observation, not a claim about how the strategy would perform without its worst trades. You cannot keep the good cycles and delete the terminal ones, because the same logic produces both. The point is narrower: the aggregate short-side figure is dominated by two events rather than by broad weakness.
The two maximum-depth failures
Two sequences changed how I read this test, one in March 2025 and one in January 2026. Both reached the maximum observed depth of eight positions. Both were shorts. Both ended the same way, and that shared terminal pattern is why they matter more than any headline ratio.
| Event | Start | Final stop | Direction | Depth | Lot ladder | Cumulative volume | Exit | Cycle P/L | Realised balance impact |
|---|---|---|---|---|---|---|---|---|---|
| March 2025 | 2025.03.03 13:30 | 2025.03.06 15:16 | SELL | 8 | 0.01→0.64 (×2 each step) | ≈1.28 lots | Common S/L @ 1.08395 | −$1,013.02 | −25.0% |
| January 2026 | 2026.01.20 06:30 | 2026.01.27 22:48 | SELL | 8 | 0.01→0.64 (×2 each step) | ≈1.28 lots | Common S/L @ 1.20490 | −$1,011.29 | −27.5% |
In March 2025 the system began shorting EURUSD at 1.04503 and kept adding as the pair climbed, position by position, up through 1.08096. This is the price path that pushed the tested recovery sequence to its maximum observed depth: a sustained one-way move against the basket, with no pullback deep enough to let the converged take-profit trigger. By the eighth position the account held about 1.28 lots short into a rising market. January 2026 repeats the pattern almost beat for beat, shorting from 1.16622 up to 1.20197 on the same ladder and the same depth.
What the order log shows at the eighth position
The modifications just before the end show how the terminal risk control behaved in this tested build. Through the first seven positions, each older trade carries a distant stop that is pushed further away as the basket deepens, so the system is holding on and waiting for the reversal. Then the eighth position, the 0.64-lot order, opens with a tight stop-loss placed just beyond its own entry. In the same instant, the order log modifies the stop-loss of all seven earlier positions to that identical level. A few hours later price touches it, and all eight positions close together at one price.
I will describe that carefully, because the wording matters. In the tested v1.2 history, reaching the eighth position was followed by a common broker-side stop being applied across the entire open sequence, after which the whole basket closed at once. That is what the execution record shows. Whether it corresponds to a named “hard drawdown control” feature in the current product is a separate question I return to below. In March 2025 the common stop sat at 1.08395 and realised −$1,013.02; in January 2026 it sat at 1.20490 and realised −$1,011.29. In balance terms, each of those single events took roughly a quarter of the account, about 25% in 2025 and 27.5% in 2026.
One more distinction is worth keeping straight. Those two cycles are about 99.6% of the negative cycle-level P/L, which is not the same as the MT4 Gross Loss of −$4,724.13. Gross Loss adds up every losing individual trade, including losing legs inside cycles that eventually finished positive. Cycle-level negative P/L counts only sequences whose total result was negative. The first sums losses on individual positions, including losing legs inside cycles that later finished positive; the second counts only cycles whose total result was negative.
The drawdown behind the smooth curve
The report gives three drawdown numbers, and they are not interchangeable. Absolute drawdown ($465.86) measures the dip below the starting deposit. Maximal drawdown ($1,386.43, 34.27%) is the largest money fall from a peak. Relative drawdown (54.03%, $627.73) is the largest percentage fall, measured at a different and smaller-balance moment, which is why the dollar figure attached to the 54% is smaller than the one attached to the 34%. Neither should be quietly replaced by a gentler realised number reconstructed from closed balances, because a closed-order reconstruction cannot see intra-basket floating equity, and the report’s own equity-based figures stand.
What the reconstruction does explain is where the visible cliffs come from. The two near-vertical drops late in the curve, one in early 2025 and one in early 2026, coincide with the two depth-eight stop-outs, and the volume sub-window shows its largest spikes underneath them. For four years the curve is a quiet diagonal because the recovery mechanism kept resolving. It stops being quiet in precisely the two places the mechanism ran to its limit.
What changed in 2025 and 2026
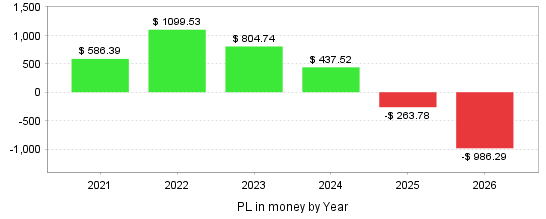
Grouped by the year a position was entered, the sample runs positive every year from 2021 to 2024, then turns negative in 2025 and the partial 2026. It is tempting to read that as the strategy breaking down, but the reconstruction points somewhere more specific. Take the single March 2025 event out of that year and the rest of 2025 contributed roughly +$749; the maximum-depth loss more than explains the negative annual figure on its own. The partial 2026 sample tells a milder version of the same story: outside the January event, the year was close to flat, near +$25. These are loss-concentration diagnostics, not an alternative strategy result, and two observations are only two observations. What they show is that the negative years were not caused by broad deterioration across ordinary trades. Each was defined by one terminal recovery failure of about a thousand dollars.
How long FXStabilizer holds its trades
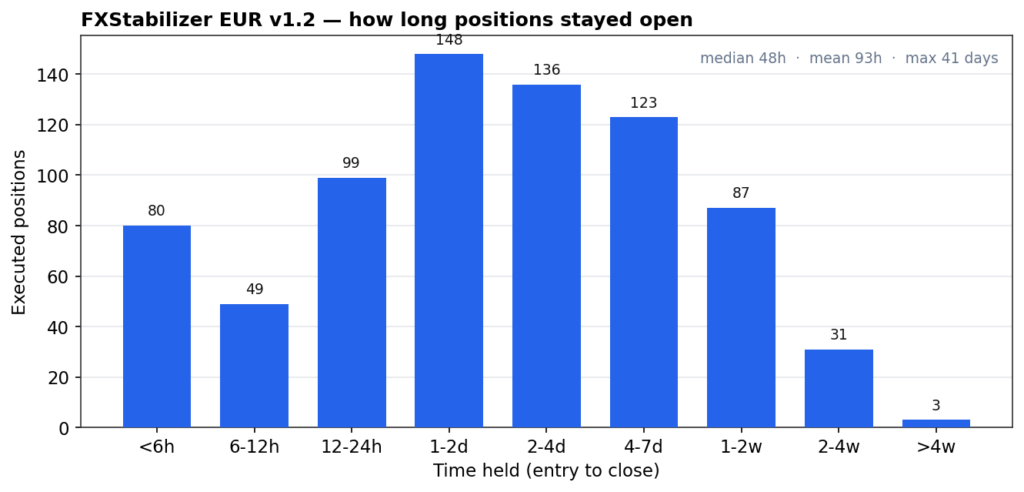
This is not a fast system, whatever the smooth curve suggests. Rebuilt from actual entry-to-close times, the median position was held about 48 hours, the mean nearly four days, and the longest single position stayed open more than 40 days. Deeper cycles hold longer, which is what you would expect from a mechanism that waits for a converged basket target. That carries a cost the MT4 summary table does not itemise. The historical report exposes no separate swap column, so I will not invent one, but positions open for days or weeks accrue overnight financing, and any real-account version of this result is sensitive to it. The vendor’s own live accounts make the point, since both carry sizeable negative interest, which I come to next.
Vendor backtests and the recent test answer different questions
FXStabilizer’s official site publishes its own EURUSD backtests, and it is worth being clear about why they and this test do not contradict each other. The official Durable run covers 2009–2016; the Turbo run covers 2013–2016. Both use AutoRisk=true with different risk limits, a $10,000 deposit, fixed spread and 90% modelling quality on a different demo server. The configuration I tested uses Mode=0, AutoRisk=false, RiskLimit=50, a $1,000 deposit and variable spread at 99.90% quality over 2021–2026. The vendor backtests show how earlier risk-scaled configurations behaved on quote history ending in 2016; this test shows how a fixed-lot configuration behaved over the last five years, a period the official pages do not cover. The useful difference is the period: the EA ForexLab test covers 2021–2026, which the official historical pages do not. I would not call the older backtests invalid for being old, and I would not read the newer one as a verdict on the vendor’s published numbers, because they do not overlap.
What the live Myfxbook accounts do and don’t show
The vendor points to two long-running Myfxbook accounts for EURUSD. Both are useful as long as they are read for what they are, which is vendor-associated monitoring rather than independent tests.
| Dimension | EA ForexLab test (v1.2_fix) | Vendor Durable backtest | Vendor Turbo backtest | Turbo EURUSD Myfxbook | Durable EURUSD Myfxbook |
|---|---|---|---|---|---|
| Evidence type | Independent (L1) | Vendor backtest (L4) | Vendor backtest (L4) | Vendor-associated live (L5) | Vendor-associated live (L5) |
| Platform | MetaTrader 4 | MetaTrader 4 | MetaTrader 4 | MetaTrader 4 | MetaTrader 4 |
| Period / status | 2021–2026 | 2009–2016 | 2013–2016 | Live (updated Aug 2026) | Stopped Jan 2025 |
| Key config | Mode=0; AutoRisk=false; RiskLimit=50 | AutoRisk=true; RiskLimit=35 | AutoRisk=true; RiskLimit=55 | Not disclosed | Not disclosed |
| Account / deposit | Demo, $1,000 | Demo, $10,000 | Demo, $10,000 | Real cent, $500 dep. | Real, $10,000 dep. |
| Modelling quality | 99.90% | 90.00% | 90.00% | — | — |
| Net result / gain | +$1,678.33 | +$176,789 | +$659,880 | +3815.19% | +1077.01% |
| Profit factor | 1.36 | 2.10 | 2.43 | 1.77 | 1.86 |
| Max drawdown | 34.27% (54.03% rel.) | 33.11% | 33.51% (45.00% rel.) | 13.26% | 24.85% |
| Broker | IC Markets | EGlobal | EGlobal | Markets4you | FXOpen (funds withdrawn) |
Turbo EURUSD, live, and a familiar profile
The Turbo EURUSD account is a real Markets4you cent account on MT4, still updating when I checked it, showing a large multi-year gain against a 13.26% drawdown. Its aggregate profile looks a lot like the tested configuration. Long and short win rates sit in the low-to-mid 60s, the average winner is near $14.87 and the average loser near $15.29 against $14.13 and $15.59 in the backtest, and the reported average trade length is about one day. It also carries about −$1,420 of accumulated interest, which is the financing cost I flagged earlier showing up on a real account.
Durable EURUSD, and reading the zero balance correctly
The Durable EURUSD account needs care. Its balance reads $0.00, which looks alarming until you check the ledger: deposits of $10,000, withdrawals of $117,701.18, and a peak balance of exactly $117,701.18. The account did not blow up. The entire balance was withdrawn, which matches the vendor’s note that FXOpen discontinued its STP account type and funds were moved out rather than lost. It last updated in January 2025. As a live record it shows the same family traits: EURUSD on MT4, directional win rates in the high-50s to low-60s, four-day average holds, and about −$10,500 of accumulated interest over its life.
Does the live trading match the tested configuration?
Only in part, and only in the parts I can actually measure. The public monitoring shares several aggregate characteristics with the tested configuration, including EURUSD trading on MT4, broadly similar directional win rates, an asymmetric average winner and loser profile, and holding periods measured in about one to several days. Those similarities are useful context, but they stop at aggregate statistics. What the public statistics do not establish is that the same recovery ladder, the same lot progression, or the same maximum-depth exit logic was used, because Myfxbook shows aggregate results, not the order-by-order structure I reconstructed from the tester report. The versions, modes, brokers, leverage and deposits also differ from the tested v1.2_fix, and neither account discloses its settings. The accounts therefore provide limited live context. They do not confirm that this specific configuration, recovery ladder or maximum-depth logic produced a particular live result. That is why I treat forward testing as a separate evidence layer rather than an extension of the backtest.
What this test does not establish
A few things I deliberately will not claim, because the evidence does not support them. The tested inputs read Mode=0, and the current product sells Durable and Turbo modes, but the official backtests carry no Mode parameter and use AutoRisk=true, so I cannot map Mode=0 onto Durable or Turbo without documentation I do not have. The current Ultimate version advertises “hard drawdown control,” and the tested history clearly applies a common hard stop at maximum depth, but I am describing an execution pattern in one build, not confirming it is that named feature. The vendor’s line that its security mechanism has not triggered “since 1997” refers to a different pair and configuration than the one here; in this EURUSD test the terminal stop plainly did trigger, twice. Version lineage across builds, and the mapping of inputs to marketed modes, remain open questions. For a second example of how recovery exposure can change the interpretation of a smooth backtest, see our Opal EA recovery-grid analysis.
Conclusion
Stripped to its structure, FXStabilizer_EUR v1.2 is a two-sided EURUSD recovery system that often closes the first position profitably and, when that entry moves against it, adds same-direction positions on a progressive lot ladder in an attempt to bring the sequence back to a shared exit. Over 2021–2026 that produced a smooth-looking +$1,678.33 at a 1.36 profit factor, with 362 of 366 cycles closing positive. The reconstruction is what gives that curve its texture. Cycles ending at depths one through seven were positive in aggregate, while risk was concentrated almost entirely in the two cycles that reached depth eight. Each of those events reduced realised balance by roughly a quarter when a sustained EURUSD move pushed the ladder to its terminal stop.
The risk characteristics visible in the evidence are straightforward to name: progressive multi-position exposure that can reach roughly 1.28 lots on a small account; financing costs on multi-day holds that the summary does not itemise; and a terminal outcome that, in this sample, arrived twice and defined both losing years. The trade-off is specific and measurable: a high share of positive reconstructed cycles alongside rare, sharp terminal losses at maximum observed depth. Anyone weighing it should look past the diagonal equity line, decide how they feel about that trade-off, and test their intended mode and broker on demo with financing and maximum-depth exposure in full view. Our Forex EA database is a reasonable place to compare it against alternatives before committing real money.
On costs specifically: a forex rebate may reduce part of eligible spread or commission across repeated multi-position recovery sequences. It does not reduce swap, it does not reduce drawdown, and it does nothing to change the maximum-depth exposure described above, so treat it as a small efficiency, not a safety margin.
Frequently asked questions
Is FXStabilizer a grid or martingale system?
The tested execution record shows a grid-like recovery structure with progressive position sizing. The first recovery entry stays at 0.01 lot, followed by an observed doubling sequence up to 0.64 lot at maximum depth, with positions closed as a basket. What the record establishes is that behaviour; it does not reveal the internal design intent behind it, so I would describe it by what it does rather than force it into a single label.
Did the backtest make money?
Yes. The MT4 report shows +$1,678.33 net over 2021–2026 from a $1,000 deposit, a 1.36 profit factor and a 59.92% position win rate. The sum of the displayed trade rows is $0.22 lower, a difference consistent with cumulative display rounding. It is a simulation, not a live result.
How can 98.9% of cycles be positive if 40% of trades lose?
They measure different things. Individual trades lose 40% of the time, but the recovery structure folds losing legs into baskets that usually close positive overall, which happened in 362 of 366 reconstructed cycles. The 98.9% simply means that 362 of 366 reconstructed flat-to-flat cycles ended with positive displayed P/L; it is not the odds on a single trade.
What actually caused the losses?
Two sequences, in March 2025 and January 2026. Both shorted EURUSD into a sustained rise, added positions to the eighth rung of the ladder, and were closed by a common stop for about −$1,013 each. Together they are roughly 99.6% of all negative cycle-level P/L, and each more than explains its year’s negative result.
Is the vendor’s Myfxbook proof it works live?
It is supporting context, not proof of this configuration. The live accounts are vendor-associated, run different modes, brokers and deposits than the tested v1.2_fix, and one of them (Durable) stopped updating in January 2025 after its balance was fully withdrawn. They share some aggregate characteristics with the backtest, but Myfxbook does not expose the order-level structure, so it cannot confirm the same recovery ladder was used.
Did the Durable account blow up?
No. Its balance shows $0.00 because the full balance was withdrawn, with withdrawals of $117,701.18 equal to its peak, consistent with the broker closing its STP account type. That is an account closure and cash-out, not a trading loss.
The archive with the EA files and full test results is available on our Telegram channel:
