


Gold Trade Pro’s historical test is profitable, but the headline result is only part of what matters. The MT4 report turns a $1,000 deposit into $2,876.95 from February 2018 to September 2023, with 1,210 trades, a 1.50 profit factor and a reported 26.55% drawdown. I rebuilt all 21,198 order events because the trade sequence answers questions that the summary page cannot: how positions were selected, how exposure accumulated, and which parts of the history actually produced the profit.
That reconstruction changes the description of the EA in two important ways. First, the tested system was not behaving like a conventional scalper. Its median position lasted more than seven hours. Second, the absence of martingale lot escalation did not mean low exposure. Position size stayed fixed at 0.01 lot, but as many as 13 same-direction positions were open together.
Key findings
- The MT4 test reports +$1,876.95 net profit from a $1,000 deposit, a 1.50 profit factor, 1,210 trades and 26.55% reported relative drawdown.
- Median holding time was 7h 10m and mean holding time about 22 hours. Only 9.75% of positions closed within five minutes.
- The EA placed 4,244 pending stop orders, of which 1,210 became market positions. The other orders were deleted or remained pending when the test ended.
- Every executed entry used 0.01 lot. I found no martingale lot progression in this historical record.
- Maximum observed market exposure was 13 simultaneous positions, or 0.13 lot. Long and short positions did not overlap.
- Across 229 flat-to-flat exposure episodes, the 129 episodes that never exceeded five simultaneous positions lost $743.31 in aggregate. The 100 episodes reaching six or more positions produced +$2,619.87. This is an association, not evidence that increasing position count creates profit.
- The main vendor-associated MQL5 signal started shortly after the backtest ended and currently has a broadly similar profit factor, but it runs on MT5 with different software and sizing. It is useful forward context, not exact validation of the tested MT4 configuration.
What I tested
The source is a complete MetaTrader 4 Strategy Tester report for Gold Trade Pro, generated on ICMarketsSC-Demo06, Build 1380. The test uses XAUUSD on D1, every-tick modelling, 99.90% modelling quality and zero mismatched-chart errors. The report shows variable spread. It does not separately disclose commission or swap, so the complete historical cost model cannot be reconstructed from this HTML file alone.
| Metric | Value |
|---|---|
| Expert Advisor (tested binary) | Gold Trade Pro_fix |
| Platform / Build | MetaTrader 4, Build 1380 |
| Test server | ICMarketsSC-Demo06 |
| Symbol | XAUUSD (Gold vs US Dollar) |
| Timeframe | Daily (D1) |
| Test period | 2018.02.21 - 2023.09.11 |
| Modelling | Every tick, 99.90% modelling quality, 0 mismatched-chart errors |
| Initial deposit | 1,000.00 USD |
| Trading-cost visibility | Variable spread shown; commission/swap not separately disclosed |
| Total net profit | +1,876.95 USD (+187.7% on deposit) |
| Gross profit / Gross loss | +5,657.63 / -3,780.68 USD |
| Profit factor | 1.50 |
| Expected payoff | 1.55 USD per trade |
| Report maximal / relative drawdown | 294.48 USD / 26.55% |
| Total executed positions | 1,210 |
| Win rate | 51.65% (625 winners / 585 losers) |
| Long positions (won %) | 682 (56.30%) |
| Short positions (won %) | 528 (45.64%) |
| Largest win / largest loss | +48.94 / -18.49 USD |
| Average win / average loss | +9.05 / -6.46 USD |
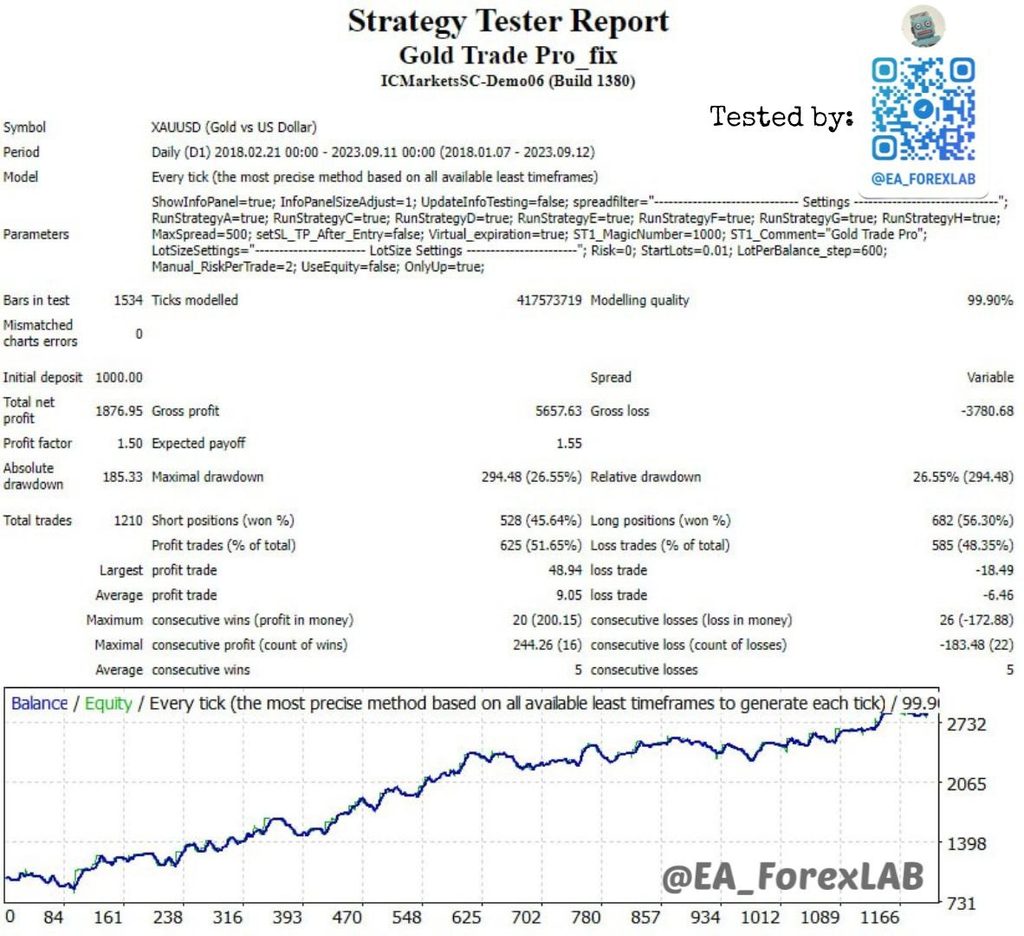
I matched every executed ticket from pending placement through entry, modifications and exit. The final balance is $2,876.95, which confirms the report’s +$1,876.95 net result. If the two-decimal profit values printed on each closing row are summed instead, they total $1,876.56. The $0.39 difference is consistent with cumulative display rounding; the running balance remains the better reconciliation anchor. The process follows our testing methodology.
The old “scalper” label does not fit the trade history
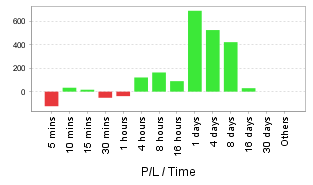
The existing URL calls Gold Trade Pro a scalping strategy. The positions tell a different story. Median holding time was 7 hours 10 minutes, the mean was 22 hours 1 minute, and the longest trade remained open for 10 days 7 hours 53 minutes. About 75% closed within one day, but only 9.75% closed within five minutes.
The shortest trades were not where the test made its money. Positions closed within five minutes lost about $135 in aggregate. Most of the positive contribution came from multi-hour and multi-day holds. That makes the tested EA much easier to understand as a daily breakout system than as a short-duration scalper.
How the breakout engine entered trades
The order book is built almost entirely from stop entries. Over the test, the EA placed 2,161 Buy Stops and 2,083 Sell Stops, with no limit orders. Of 4,244 pending placements, 3,020 were deleted, 1,210 triggered into market positions, and 14 were still pending at the end of the report. The fill rate was 31.6% for Buy Stops and 25.3% for Sell Stops.
The initial order geometry is cleaner than it first appears. Measured from the requested pending-order price, not from the eventual fill, all 1,210 executed trades fall into exactly six SL/TP distance profiles: 13/17 points (610 trades), 6/49 (160), 10/19 (127), 12/16 (123), 6/17 (104) and 12/18 (86). These are execution fingerprints, not proven strategy IDs. The historical inputs enable seven labels, A/C/D/E/F/G/H, but the report does not expose a reliable mapping between those labels and the six observed price geometries.
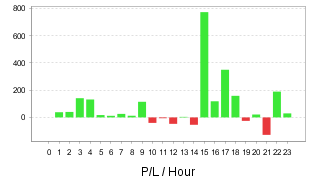
Entry times are also clustered. Server hour 15 contributed about $773 of displayed trade profit, while several other hours were negative. I keep those hours in broker/test-server time because the historical report does not establish a stable GMT mapping across the full period.
| Aspect | What the ledger shows | EA ForexLab note |
|---|---|---|
| Classification | Multi-strategy daily breakout system | Historical holding times do not fit a conventional scalper |
| Median holding time | 7h 10m | Mean 22h 01m; max 10d 7h 53m |
| Short holds | 9.75% <=5 min; 22.73% <=1 hour | 52.48% <=8h; 75.37% <=1 day |
| Position sizing | All 1,210 entries were 0.01 lot | No martingale lot progression observed |
| Pending orders | 2,161 buy stops; 2,083 sell stops | 4,244 placements total; no limit orders |
| Pending lifecycle | 3,020 deleted; 1,210 filled; 14 left at test end | Buy fill 31.6%; sell fill 25.3% |
| Observed initial SL/TP profiles | Exactly 6 requested-price geometry profiles | Largest: 13/17 with 610 trades |
| Exit types | 952 s/l; 255 t/p; 2 close at stop; 1 close | 1,210 exits total |
| Profitable s/l exits | 370 of 952 (38.9%) | An s/l label did not necessarily mean a losing trade |
| Stop management | 11,514 post-entry SL modifications | 1,040 positions (86.0%) had SL moved; avg 11.07 moves where moved |
| SL reached entry or better | 643 positions (53.1%) | TP was not modified after entry |
| Max simultaneous positions | 13 | Maximum observed aggregate volume 0.13 lot |
| Long / short overlap | None observed | Exposure stayed one-directional |
Stops were actively managed
Of the 1,210 exits, 952 are labelled s/l, 255 t/p, two close at stop and one close. An SL-labelled exit was not necessarily a loss: 370 of the 952 SL exits finished with positive P/L.
The modification history explains why. After entry, the EA changed Stop Loss levels 11,514 times across 1,040 positions, or 86.0% of all trades. Positions with a modified stop averaged 11.07 SL changes. In 643 positions, the stop eventually reached the entry price or moved beyond it in the profitable direction. I found no post-entry TP changes. This is strong historical evidence of active stop management, although the ledger alone does not tell us the internal rule that generated each modification.
No martingale lot progression, but exposure still stacked
All 1,210 market entries were 0.01 lot. There was no lot doubling after losses and no size progression as exposure increased. On that narrow question, the historical record is clear: I found no martingale lot progression.
Exposure accumulated through the number of positions instead. The maximum observed concurrency was 13 positions, equivalent to 0.13 lot at the fixed historical size. Long and short positions never overlapped. The account was either long, short or flat.
To examine whether those extra positions resembled recovery averaging, I grouped the history into 229 flat-to-flat episodes. An episode begins when the account moves from flat to an open market position and ends when the last position closes. The grouping follows the raw MT4 event order, which matters when a close and a new entry share the same minute.
There were 981 entries after the first entry of an episode. Of those, 450 occurred at the same timestamp as an earlier entry and are better treated as simultaneous breakout participation rather than a later averaging decision. Among the remaining 531 later-timestamp entries, 465 (87.6%) were beyond the first entry price in the favourable direction, 55 (10.4%) were adverse and 11 were effectively unchanged at the report’s price precision. That pattern is more consistent with breakout layering than with a conventional recovery grid that adds primarily as the position moves against the account.
Historical profit was concentrated in deeper exposure episodes
The depth analysis is the most useful result of the reconstruction, but it needs careful wording. The 129 episodes that never exceeded five simultaneous positions produced -$743.31 in aggregate. The 100 episodes that reached six or more positions produced +$2,619.87. Together they reconcile to the $1,876.56 sum of the displayed per-trade P/L rows. The MT4 headline net remains $1,876.95 because of the rounding difference described earlier.
The relationship is not simply “more positions equals more profit.” Depth 6, 7 and 8 were positive in aggregate even though only about 46% to 50% of those episodes finished positive. The strongest separation appears at depth 9 and above: 21 of 23 such episodes were positive, or 91.3%. Even there, position count is not a causal variable. A stronger breakout can both trigger more strategy modules and give the open positions more room to profit. The defensible conclusion is narrower: historical profitability was concentrated in episodes where more of the strategy stack became simultaneously exposed.
| Peak simultaneous positions | Episodes | Entries | Net P/L (USD) | Positive episodes |
|---|---|---|---|---|
| 1 to 5 | 129 | 380 | -743.31 | 50 / 129 (38.8%) |
| 6 | 26 | 167 | +104.10 | 13 / 26 (50.0%) |
| 7 | 41 | 296 | +455.73 | 19 / 41 (46.3%) |
| 8 | 10 | 93 | +151.10 | 5 / 10 (50.0%) |
| 9 | 10 | 107 | +671.99 | 9 / 10 (90.0%) |
| 10 to 13 | 13 | 167 | +1,236.95 | 12 / 13 (92.3%) |
| All episodes | 229 | 1,210 | +1,876.56 | 108 positive / 120 negative / 1 flat |
Direction also mattered. Long trades contributed about +$1,568.92 of displayed P/L, while shorts contributed about +$307.64. Longs won 56.30% of the time versus 45.64% for shorts. I would not extrapolate that long-side dominance outside this test window; it is a property of this historical sample.
The payoff structure was reasonably balanced. The average winner was +$9.05 and the average loser -$6.46, a winner/loss magnitude ratio of about 1.40. That puts the break-even win rate near 41.7%, below the observed 51.65%. Historical expectancy therefore came from both sides of the equation: a win rate above break-even and winners that were larger than losers on average.
The result was positive, but not evenly distributed through time
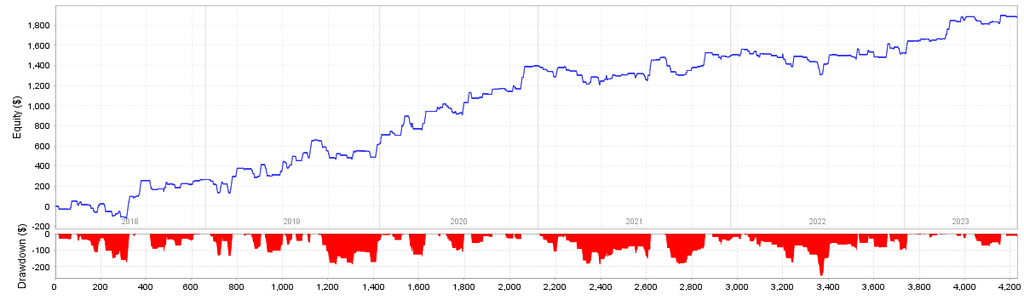
By exit year, displayed P/L was approximately +$266 in 2018, +$356 in 2019, +$774 in 2020, +$102 in 2021, +$29 in 2022 and +$350 in the partial 2023 period. The full test was profitable, but 2021 and especially 2022 were much weaker than 2020 or the partial 2023 sample.
Profit was concentrated at episode level as well. The best flat-to-flat episode made $229.56 and the worst lost $89.87. The five best episodes account for about 53% of the MT4 headline net, and the ten best for about 91%. The top 20 exceed 100% of final net because losses elsewhere offset part of their contribution. That is typical of systems whose returns arrive in bursts rather than evenly from one trade to the next.
Drawdown: what the report shows and what the ledger can reconstruct
The MT4 summary reports maximal drawdown of $294.48 and relative drawdown of 26.55%. A reconstruction using only the sequence of closed-trade balances produces a smaller maximum drawdown of about $255.49, or 16.37% of the preceding balance peak.
I do not treat the difference as proof that a specific 13-position stack caused the 26.55% figure. The HTML ledger contains order events and closing balances, but not the full tick-by-tick equity path needed to attribute the report’s worst floating drawdown to one exact episode. The safer reading is that the summary reports materially more drawdown than the closed-trade balance sequence alone reveals. For risk assessment, the higher reported figure is the more conservative reference.
The current Gold Trade Pro is a different software state
The historical report identifies the expert as Gold Trade Pro_fix but does not expose a version number. That prevents a clean one-to-one comparison with the product sold today.
At the 22 August 2026 checkpoint, the official MQL5 listing shows Gold Trade Pro MT4 v6.1, updated 11 February 2026, and Gold Trade Pro MT5 v6.70, updated 19 May 2026. The current MT4 description says seven strategies; the MT5 description says eight. The historical input block also enables seven labels, but that does not prove they are identical to the current MT4 strategy set.
The official MT4 and MT5 changelogs show substantial development after the test period: NFP filtering and AutoGMT, alternative trailing logic, price-dependent entry/SL/TP adjustments, new lot-sizing methods, fake-breakout filtering, OnlyUp fixes and, on MT5, an additional strategy 8. Those changes are enough to treat the tested binary and today’s product as related versions of the same strategy family rather than the same configuration.
We keep versioned EA research organised in the Forex EA Database.
What the post-backtest live signals add
The timing of the primary public signal is useful. Our historical test ends on 11 September 2023; the vendor-associated Goldtrade Pro ICM signal starts on 29 September 2023. That gives us a long period of public live evidence after the backtest window, although it is not an EA ForexLab forward test and it does not run the same MT4 binary.
At the 22 August 2026 snapshot, MQL5 reports 716 trades, 57.82% winners, a 1.58 profit factor, +€41.46 average profit, -€35.94 average loss and about 10 hours average holding time. Relative drawdown is 31.95% by balance and 12.17% by equity. MQL5 reports 94% Algo Trading, so I would not assume that every trade in the account is attributable to the EA without trade-level attribution. The signal description says it is running Gold Trade Pro with LotsizeStep=1000.
The historical and live fingerprints have some broad similarities: profit factor is 1.50 versus 1.58, both samples win below 60% of trades, and positions are commonly held for hours rather than minutes. There are meaningful differences too. The live account is MT5, its long share is higher at 69.41%, its sizing is different, and its history spans several software versions. MQL5 also reports that 80% of the signal’s growth was achieved in only 10 days, which reinforces how episodic the account-level result has been.
The separate Goldtrade Pro High Risk signal should not be used to characterise standard risk. At the same snapshot it shows 523 trades, 55.44% winners, PF 1.36, 60.45% relative balance drawdown, 31.28% relative equity drawdown and 88% Algo Trading. Its description explicitly uses LotsizeStep=450, and MQL5 says 80% of growth was achieved in six days.
| Dimension | EA ForexLab historical test | Primary MQL5 signal #2084890 | High-Risk MQL5 signal #2242498 |
|---|---|---|---|
| Evidence type | Independent MT4 historical simulation | Vendor-associated public MT5 signal | Vendor-associated public MT5 signal |
| Period / start | 2018.02.21 - 2023.09.11 | Started 2023.09.29; snapshot 2026.08.22 | Started 2024.07.10; snapshot 2026.08.22 |
| Platform | MT4 Build 1380 | MT5, ICMarketsSC-MT5-4 | MT5, CapitalPointTrading-MT5-4 |
| Version certainty | Version not exposed | Current/history spans multiple software versions | Current/history spans multiple software versions |
| Trades | 1,210 | 716 | 523 |
| Win rate | 51.65% | 57.82% | 55.44% |
| Profit factor | 1.50 | 1.58 | 1.36 |
| Average win / loss | +9.05 / -6.46 USD | +41.46 / -35.94 EUR | +67.55 / -61.64 EUR |
| Holding time | Median 7h10m; mean 22h01m | Average 10h | Average 8h |
| Relative drawdown | Report: 26.55% | Balance 31.95%; equity 12.17% | Balance 60.45%; equity 31.28% |
| Long share | 56.36% | 69.41% | 71.13% |
| Sizing evidence | All entries 0.01 lot | Signal description: LotsizeStep=1000 | Signal description: LotsizeStep=450 |
| Algo Trading | Historical tester ledger | 94% | 88% |
| Growth concentration | Not directly comparable to MQL5 Growth metric | 80% of MQL5 growth in 10 days | 80% of MQL5 growth in 6 days |
| Main limitation | Historical simulation; exact binary version unknown | Vendor-controlled signal; MT5/version/sizing differ; Algo <100% | Explicit high-risk profile; MT5/version/sizing differ; Algo <100% |
This is useful post-test evidence, but it is not configuration-level validation. Platform, version, strategy selection and sizing differ. For why that distinction matters, see our guide to forward testing an Expert Advisor.
Trading costs are only partly visible in this report
The historical tester shows variable spread, but it does not separately expose commission or swap. I therefore cannot calculate a complete historical transaction-cost drag from this HTML report. That matters because the expected payoff is only $1.55 per trade at the tested 0.01-lot size, and a live account introduces broker-specific commissions, spread behaviour, swaps and execution differences.

Where a broker account is eligible, a forex rebate can return part of eligible trading costs. It does not change the entry logic, reduce slippage, lower market risk or make the historical edge more robust. It is simply a cost adjustment.
Conclusion
After rebuilding the full order history, I would describe the tested Gold Trade Pro as a fixed-size, multi-module XAUUSD breakout system with conditional exposure stacking. It was not a conventional scalper, and I found no martingale lot progression or conventional recovery-grid behaviour in this historical execution record.
The more important qualification is where the profit appeared. Shallow exposure episodes were negative in aggregate, while most of the historical net came from episodes in which more modules were active at the same time. That does not mean position count caused the profit; strong breakouts are a plausible common driver of both deeper exposure and better outcomes. The test also had uneven years and substantial result concentration, so the smooth long-term curve should not be read as a uniform return process.
The public MQL5 signal is valuable because it begins shortly after the backtest ends and now contains several years of live history with a broadly comparable profit factor and holding-time profile. It still cannot validate the exact tested configuration. The live account uses MT5, different sizing, spans multiple software versions and is not classified as 100% Algo Trading by MQL5. The historical result is therefore useful evidence about how this 2018-2023 configuration behaved, while the current product needs to be evaluated as a newer system state.
Frequently asked questions
Is Gold Trade Pro a scalper?
No, not in this historical test. The median trade lasted 7 hours 10 minutes, the average about 22 hours, and the longest position more than ten days. Only 9.75% of positions closed within five minutes. The tested behaviour fits a daily breakout system better than a conventional scalper.
Does Gold Trade Pro use martingale or grid trading?
I found no martingale lot progression or conventional recovery-grid behaviour in this historical execution record. All 1,210 entries were 0.01 lot. Multiple same-direction positions were common, but among later-timestamp additions 87.6% were beyond the first entry price in the favourable direction, which is more consistent with breakout layering than recovery averaging.
How many positions could Gold Trade Pro hold at once?
The maximum observed in this test was 13 simultaneous market positions, all in the same direction, for 0.13 lot aggregate exposure at the fixed historical size. This is an observed maximum in this report, not a guaranteed hard cap for other versions or settings.
What drawdown did the backtest report?
The MT4 summary reports $294.48 maximal drawdown and 26.55% relative drawdown. A closed-trade balance reconstruction produces a smaller 16.37% drawdown, but the HTML does not contain the full tick-by-tick equity path needed to explain the exact difference. I therefore use the report’s 26.55% figure as the conservative historical reference.
Does the live Gold Trade Pro signal confirm the backtest?
It provides useful post-backtest evidence, but not exact validation. The main MQL5 signal started shortly after the historical test ended and currently has a similar profit factor, but it runs on MT5, uses different sizing, spans multiple software versions and is reported as 94% Algo Trading rather than 100%.
Is the Gold Trade Pro sold today the same version that was tested?
No exact version match can be established. The historical report does not expose a version number. At the 22 August 2026 checkpoint, MQL5 lists MT4 v6.1 and MT5 v6.70, with substantial changes documented after the historical test period.
The archive with the EA files and full test results is available on our Telegram channel:
