


The headline result is easy to like: the MT4 Forex CCI Scalping Robot turned a $1,000 starting balance into a reported +$1,501.61 net profit on EURUSD H1 over six years, with a 75.96% win rate, a 1.59 profit factor and 99.90% modelling quality. The equity curve looks smooth for most of the period.
The 2,908-trade history is more revealing. When a position moved against the EA, it almost always added another position in the same direction at a worse price and increased the lot by 0.01. Most of the historical profit came from recovery sequences that ended early. Once recovery sequences became deeper, the economics deteriorated sharply – and in 2023 those deeper baskets lost more than the shallow baskets earned.
Key findings
- Setup: MT4, EURUSD H1, Darwinex tick data via TDSv2, GMT +2 / US DST, real variable spread, every-tick 99.90%, ICMarketsSC-Demo06 (Build 1403), $1,000 deposit, 2018.01.01-2023.12.29.
- Headline result: +$1,501.61 net, profit factor 1.59, 2,908 trades and 75.96% winners.
- Asymmetric payoff: the average loss (-$3.63) is about twice the average win (+$1.83). Based on those observed averages, the implied break-even win rate is about 66.5%.
- Progressive averaging: of 1,564 additions made while a same-direction position was already open, 1,563 were opened at a worse price – and all 1,564 increased the lot by exactly 0.01.
- Exposure expansion: the base position was 0.01 lot; the EA reached 6 simultaneous positions and 0.21 lot of aggregate exposure, or 21 times the base position.
- No broker-side SL/TP on entries: every entry shows SL = 0.00000 and TP = 0.00000; positions were closed by EA-generated close commands.
- Where the profit came from: depth 1-2 baskets produced +$2,126.50, while baskets that reached depth 3+ produced -$623.90 in aggregate.
- 2023 isolation test: -$43.66, profit factor 0.94 and 18.77% maximal drawdown, using the same 535 economic trades found in the 2023 portion of the long run.
What we tested
The six-year test
The primary record is an MT4 Strategy Tester run on EURUSD H1 from 1 January 2018 to 29 December 2023. The test used Darwinex tick data through TDSv2, GMT +2 with US DST, real variable spread and the every-tick model at 99.90% modelling quality, with zero mismatched-chart errors. It ran on ICMarketsSC-Demo06 (Build 1403) with a $1,000 starting deposit; slippage was not modelled. The tester reports +$1,501.61 net profit, $4,036.19 gross profit, -$2,534.58 gross loss, a 1.59 profit factor and 2,908 trades, of which 2,209 were winners (75.96%). Our approach to backtest evaluation is described in the EA ForexLab testing methodology.
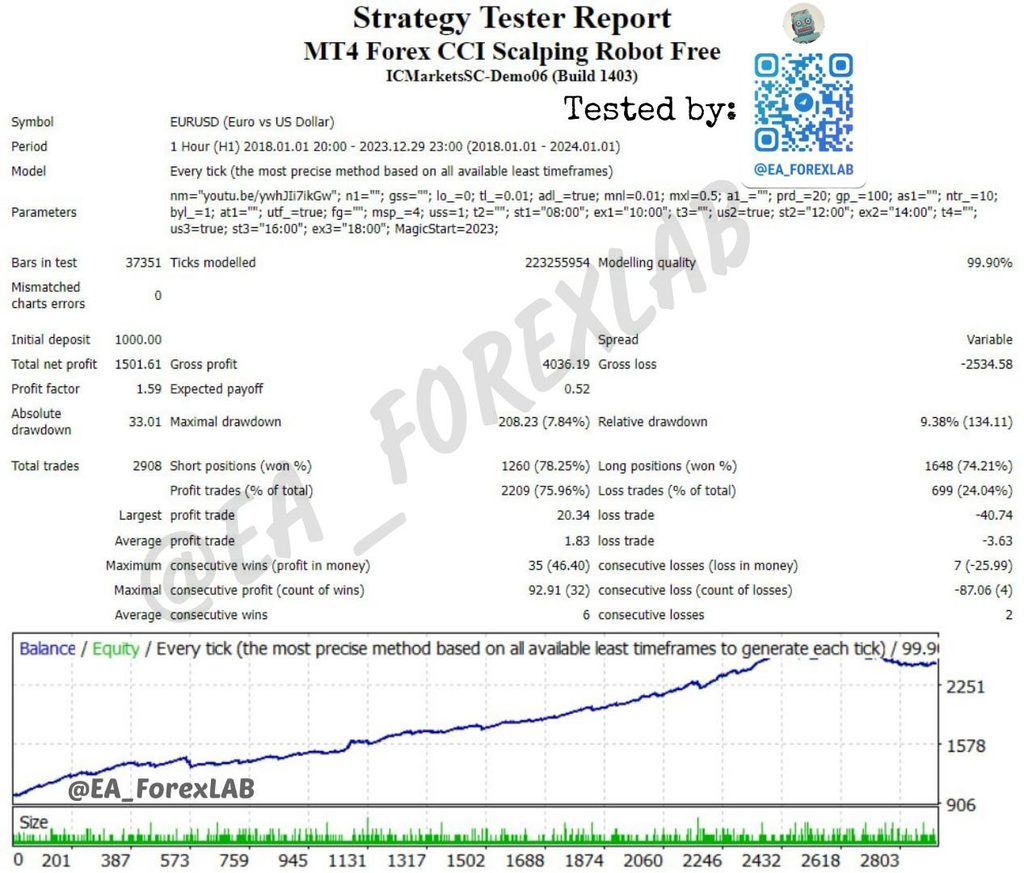
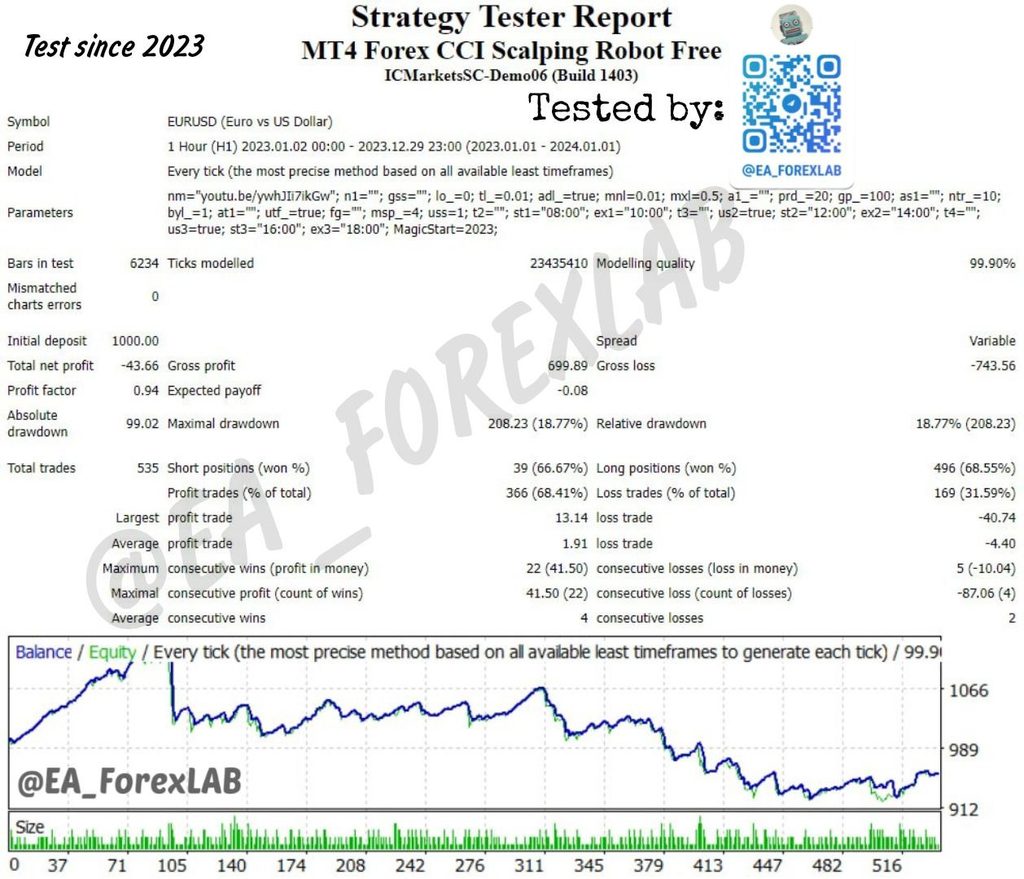
The equity curve rises steadily through most of 2018-2022, then gives back part of the gain near the end of the sample. The drawdown panel changes at the same time: what had been relatively contained becomes visibly wider in 2023. That final period deserves more attention than the smooth six-year headline suggests.
The 2023 isolation test
The second run keeps the same configuration and isolates 2 January to 29 December 2023. It contains 535 trades and finishes at -$43.66 with a 0.94 profit factor and $208.23 maximal drawdown (18.77%). More importantly, those 535 trades match the 2023 trades inside the long run by timestamp, direction, lot size, entry and exit price, and displayed per-trade P/L. Rows sharing the same timestamp can appear in a different order, but they represent the same set of trades.
This gives us a like-for-like comparison. The negative 2023 result comes from the final-year slice of the same tested behaviour, not from a different settings profile. We treat it as a historical isolation test, not as out-of-sample or forward validation. A true forward test answers a different question.
| Metric | Value |
|---|---|
| Expert Advisor | MT4 Forex CCI Scalping Robot Free |
| Platform / Build | MetaTrader 4, Build 1403 |
| Test server | ICMarketsSC-Demo06 |
| Symbol / Timeframe | EURUSD, H1 |
| Tick data | Darwinex via Tick Data Suite v2 (TDSv2) |
| GMT / DST | GMT +2 / US DST |
| Model | Every tick, 99.90% modelling quality, 0 mismatched-chart errors |
| Spread | Real variable spread |
| Slippage | Not modelled |
| Initial deposit | $1,000 |
| Six-year test period | 2018.01.01 - 2023.12.29 |
| 2023 isolation test period | 2023.01.02 - 2023.12.29 |
What the headline numbers do not show
The payoff shape is the first warning. The average winner is +$1.83; the average loser is -$3.63. In other words, an average losing trade costs almost twice as much as an average winner earns. Using those observed averages, the implied break-even win rate is about 66.5%. The six-year result clears that threshold with a 75.96% win rate, but the margin depends on losses remaining contained and the win rate staying high.
That payoff profile becomes more important once we look at how the EA handles an adverse first entry: it usually adds more exposure in the same direction.
| Max recovery depth | Full baskets | Full P/L | Full positive % | 2023 baskets | 2023 P/L | 2023 positive % |
|---|---|---|---|---|---|---|
| 1 | 625 | +$1,218.82 | 98.24% | 99 | +$193.48 | 97.98% |
| 2 | 468 | +$907.68 | 79.27% | 57 | +$28.62 | 68.42% |
| 3 | 206 | -$79.25 | 60.68% | 48 | -$89.39 | 54.17% |
| 4 | 37 | -$303.60 | 37.84% | 10 | -$166.39 | 30.00% |
| 5 | 7 | -$179.35 | 14.29% | 2 | -$9.93 | 50.00% |
| 6 | 1 | -$61.70 | 0.00% | - | - | - |
| Depth 1-2 subtotal | 1,093 | +$2,126.50 | 156 | +$222.10 | ||
| Depth 3+ subtotal | 251 | -$623.90 | 60 | -$265.71 | ||
| All baskets | 1,344 | +$1,502.60 | 216 | -$43.61 |
What happens when the first trade fails
It adds at worse prices
Across the full history, 1,564 entries were opened while another position in the same direction was already active. Of those, 1,563 were entered at a worse price than the most recent active position – lower for buys and higher for sells. That is 99.94% of all same-direction additions. The median spacing between successive additions was about 12.8 pips; the mean was about 19.1 pips.
The pattern is consistent: when price moves against an open position, the EA usually adds another position rather than reducing exposure.
The lot rises with the recovery sequence
The additions are not equal-sized. Every one of the 1,564 same-direction additions increased the lot by exactly 0.01 compared with the previous active position. The sequence is linear – 0.01, 0.02, 0.03 and upward – rather than the geometric doubling associated with a classic martingale. The most precise description is progressive-lot averaging, or a recovery ladder.
Whatever label we use, the exposure pattern is the same: the farther the original trade moves offside, the more capital the EA commits to the recovery.
Maximum observed exposure
The largest individual position in the history was 0.06 lot. The EA reached a maximum of six simultaneous positions and 0.21 lot of aggregate exposure, consistent with a 0.01 + 0.02 + 0.03 + 0.04 + 0.05 + 0.06 stack. At its deepest observed point, the basket therefore carried 21 times the initial 0.01-lot position.
Every market entry also shows SL = 0.00000 and TP = 0.00000. The history contains 2,907 ordinary EA-generated closes plus one “close at stop” row at the end of the test. For risk interpretation, the important detail is that the entries shown here carry no broker-side Stop Loss or Take Profit. Any exit logic handled inside the EA sits outside those SL/TP fields.
Profit was concentrated in shorter trades
Holding-time analysis
The word “scalping” only describes part of the behaviour. The median trade lasted about 2.1 hours and the mean about 8.6 hours, while the longest position remained open for more than seven days. Roughly one third of trades closed within an hour, about half within two hours, and around 91% within one day.

The P/L split by holding time makes the pattern clearer. Trades closed within one hour produced about +$1,790.86. Trades held longer than one hour produced roughly -$288.26 in aggregate. Under four hours, the result was about +$2,401.04; beyond four hours, about -$898.44. Positions held longer than a day lost -$577.93. The median winning trade lasted roughly 1.42 hours, compared with about 6.22 hours for the median losing trade.
Why the longer trades matter
Holding time is not the cause by itself. It is a marker of what happens after the first entry does not resolve quickly. Shorter trades tend to close with small gains; longer trades are disproportionately the positions that enter the recovery sequence and accumulate additional exposure. Duration and recovery depth are two views of the same underlying behaviour.
Recovery depth changes the economics
Shallow baskets produced the profit
We grouped the trades into directional exposure baskets: from the first position in one direction through the final close of that directional sequence. The full history contains 1,344 baskets.
Depth-1 baskets – 625 in total – produced +$1,218.82 and were positive 98.24% of the time, with a median resolution time of about 2.6 hours. Depth-2 baskets – 468 in total – added another +$907.68 at a 79.27% positive rate. Together, depth 1-2 produced +$2,126.50, more than the entire reported net profit of the six-year backtest.
Depth 3 and beyond
From depth 3 onward, the aggregate result turns negative. Depth-3 baskets produced -$79.25; depth-4, -$303.60; depth-5, -$179.35; and the single depth-6 basket, -$61.70. Combined, depth 3+ produced -$623.90.
That does not mean an additional position automatically creates a loss. It means the historical edge was concentrated in baskets that resolved before recovery became deep. Once a sequence reached three or more simultaneous positions, the group as a whole lost money.
| Metric | Six-year test (2018-2023) | 2023 isolation test |
|---|---|---|
| Net profit | +$1,501.61 | -$43.66 |
| Profit factor | 1.59 | 0.94 |
| Expected payoff | +$0.52 | -$0.08 |
| Trades | 2,908 | 535 |
| Win rate | 75.96% | 68.41% |
| Average win | +$1.83 | +$1.91 |
| Average loss | -$3.63 | -$4.40 |
| Break-even win rate (from averages) | 66.48% | 69.73% |
| Win-rate margin vs break-even | +9.48 pts | -1.32 pts |
| Maximal drawdown | $208.23 (7.84%) | $208.23 (18.77%) |
| Relative drawdown | 9.38% ($134.11) | 18.77% ($208.23) |
| Max observed simultaneous positions | 6 | 5 |
| Max observed aggregate volume | 0.21 lot | 0.15 lot |
The worst episode shows the mechanism clearly. On 15-16 March 2023, a BUY basket opened five entries, reached four simultaneous positions and 0.10 lot of exposure, remained active for about 20 hours and closed at -$83.02. The largest individual loss in the entire six-year history, -$40.74, occurred inside that basket. One failed sequence therefore produced a basket loss many times larger than a normal winning trade.
Why 2023 was different
The win rate slipped below its implied break-even level
There was no spectacular collapse in 2023. The win rate fell to 68.41%, while the average loss widened to -$4.40 against a +$1.91 average win. Those observed averages imply a break-even win rate of about 69.73%. The actual result finished roughly 1.3 percentage points below that level.
That small gap was enough to turn the year negative. This is the central weakness of a high-win-rate recovery system: the win rate can still look respectable while a modest deterioration in loss size and recovery frequency removes the edge.
The year became heavily long-biased
Across the full six-year history, shorts contributed more profit: +$928.97 from 1,260 trades versus +$573.63 from 1,648 long trades. The directional equity curves show the difference clearly. The short side rises more steadily; the long side climbs, peaks and gives back part of the gain.
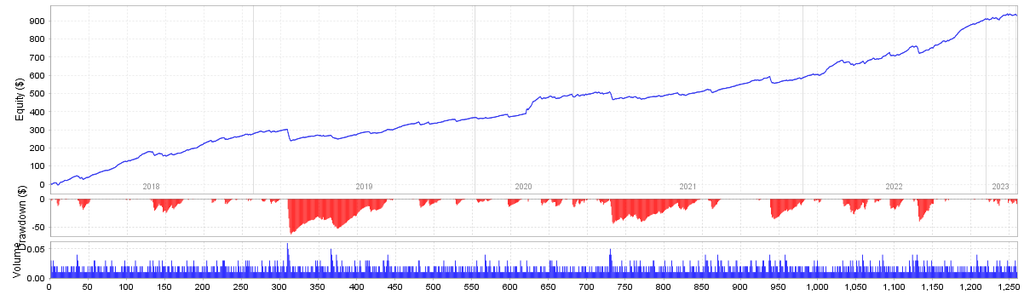

In 2023, 496 of the 535 trades were long and only 39 were short. The long side finished at -$64.11; the short side at +$20.50. This does not make direction the sole explanation for the year, but it shows where the exposure was concentrated while performance weakened.
Deep recovery losses outweighed shallow-basket gains
The depth breakdown explains the year best. In 2023, depth 1-2 baskets were still profitable at +$222.10. Baskets reaching depth 3+ lost -$265.71. On the displayed trade-level P/L, those groups combine to -$43.61 for the year.
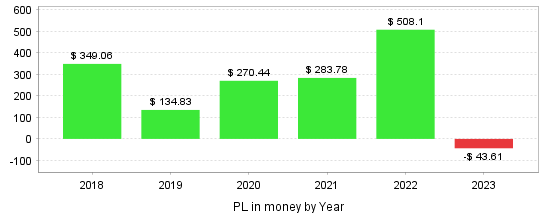
By entry year, the displayed trade-level results were +$349.06 in 2018, +$134.83 in 2019, +$270.44 in 2020, +$283.78 in 2021, +$508.10 in 2022 and -$43.61 in 2023. The important change is not simply that one calendar year turned red. It is that the same recovery mechanism that had been manageable in earlier years became expensive enough to outweigh the profit from shallow baskets.
Note on totals: displayed per-trade P/L sums to +$1,502.60 for the full history and -$43.61 for 2023, versus MT4 summary totals of +$1,501.61 and -$43.66. The small differences are consistent with cumulative two-decimal display rounding. We use the MT4 summary totals for headline performance figures.
Drawdown: why the six-year percentage needs context
The largest peak-to-trough currency drawdown reported by the tester is $208.23, and that same dollar amount appears in both runs. What changes is the percentage. In the six-year report, $208.23 is shown as 7.84% maximal drawdown, alongside a separate relative drawdown of 9.38% ($134.11). MetaTrader 4 defines maximal drawdown and relative drawdown as distinct report metrics, so their peaks do not have to occur at the same point.
In the 2023-only run, the same $208.23 maximal drawdown equals 18.77% against the smaller account base. Because the identical $208.23 event appears in both reports, the largest currency drawdown in the six-year history occurred during 2023. This is why the six-year percentage should not be read in isolation: the recovery mechanism produced the same dollar drawdown, but its percentage impact changed with the account balance beneath it.
Is this really a scalping EA?
Partly. Many positions close within one or two hours, and the profitable results are concentrated in shorter holds. But the median trade lasts about 2.1 hours, some positions remain open for days, and the risk behaviour is dominated by progressive averaging when a trade moves offside. Calling it only a scalper misses the part of the strategy that matters most for drawdown and tail risk.
How to read this backtest
The tested behaviour is the part worth focusing on. On EURUSD H1 over 2018-2023, the backtest produced +$1,501.61 at a 1.59 profit factor. The trade history shows a consistent recovery ladder: adverse positions are usually followed by same-direction additions at worse prices, with the lot increased by 0.01 each time. Profit was concentrated in shallow baskets, while depth 3+ was negative in aggregate. The 2023 isolation run then shows the same mechanism under a less favourable year, finishing at a 0.94 profit factor.
This remains a historical MT4 Strategy Tester result on EURUSD H1. It was run with Darwinex tick data through TDSv2 and real variable spread; live execution, slippage and broker-specific trading costs can still change the outcome, especially for a strategy built around frequent small trades. The deepest basket observed here is six positions, so six is the maximum reached in this sample rather than a claimed hard strategy limit. Our strategy classification comes from the order behaviour in the test: same-direction averaging, worsening entry prices and a linear increase in lot size.
For traders using eligible broker accounts, rebates can offset part of trading costs, but they do not change the recovery ladder, payoff asymmetry or market risk. We track comparable systems and test results in the Forex EA Database.
Conclusion
A profitable six-year curve is easy to notice. What matters more is the mechanism underneath it.
The EA won often, but the average loss was almost twice the average win. When trades moved against it, it usually added another position at a worse price and increased the lot by 0.01. Baskets that resolved at depth 1-2 generated more than the entire net profit; baskets that reached depth 3+ were negative in aggregate.
2023 shows why that dependency matters. Shallow baskets still made money, but deeper recovery sequences lost more than they earned. The win rate remained high at 68.41%, yet it slipped just below the break-even level implied by the year’s wider average loss. The loss itself was modest at -$43.66. More important is how quickly the edge disappeared once deeper recoveries became costly.
So the main risk is not that this EA loses frequently. It is the opposite: the strategy can look stable for a long time because most sequences resolve quickly, while the minority that require deeper recovery carry disproportionate damage. For this EA, recovery depth tells us more about the quality of the backtest than the 75.96% win rate on its own.
FAQ
Is Forex CCI Scalping Robot profitable?
In the six-year EURUSD H1 backtest, yes: +$1,501.61 net profit with a 1.59 profit factor. The isolated 2023 run was slightly negative at -$43.66 and a 0.94 profit factor. The backtest therefore shows a profitable long sample with a clear deterioration in the final year, not a uniformly stable edge.
Does Forex CCI Scalping Robot use martingale?
Not in the classic doubling-lot sense. It increases position size during recovery, but the observed progression is linear: 0.01, 0.02, 0.03 and so on. We classify it as progressive-lot averaging or a recovery ladder rather than classic martingale.
Does it use averaging or grid trading?
Yes, the trade history shows systematic averaging. Of 1,564 additions made while a same-direction position was already open, 1,563 were entered at a worse price, and all 1,564 increased the lot by exactly 0.01. That is a structured recovery mechanism rather than ordinary position diversification.
Does the EA use a Stop Loss?
No broker-side Stop Loss or Take Profit is attached to the entries in this test: every entry shows SL = 0.00000 and TP = 0.00000. Positions were closed by EA-generated close commands, so the visible order record relies on EA-controlled exits rather than attached broker-side SL/TP levels.
How many positions can it open at once?
The maximum observed in the six-year history was 6 simultaneous positions with 0.21 lot of aggregate exposure, or 21 times the 0.01-lot base position. In the 2023 isolation run, the maximum was 5 positions and 0.15 lot. These figures describe the deepest exposure reached in the tested samples.
Is it really a scalper?
Only partly. Many trades close within one or two hours and most of the profit came from shorter holds, but the median trade lasted about 2.1 hours and some positions remained open for days. More importantly, losing sequences are managed through progressive averaging, which makes recovery depth a major part of the strategy’s risk profile.
Why did the 2023 backtest lose money?
Shallow baskets at depth 1-2 still produced +$222.10 in 2023, but baskets reaching depth 3+ lost -$265.71. At the same time, the win rate fell to 68.41%, just below the roughly 69.7% break-even rate implied by the year’s +$1.91 average win and -$4.40 average loss. Deeper recovery losses were enough to outweigh the remaining shallow-basket edge.
The archive with the EA files and full test results is available on our Telegram channel:
