

🔍 From subscriber‼️
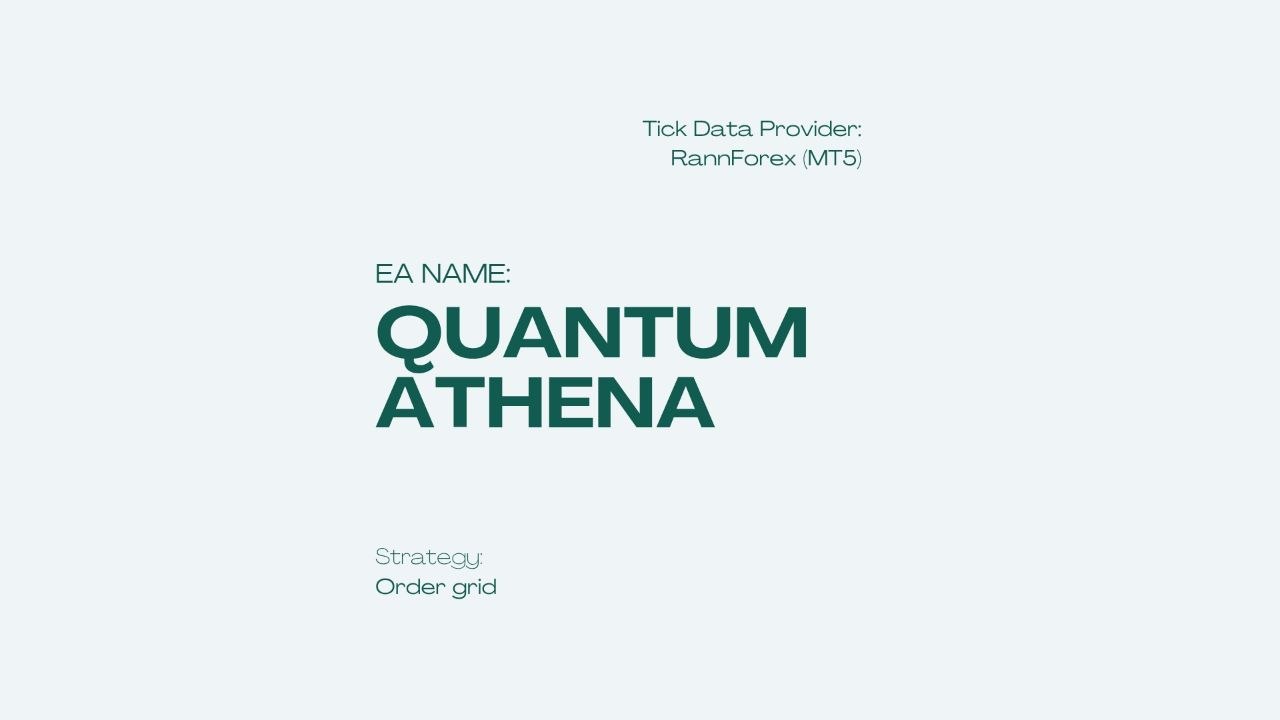
🤖 EA name:Quantum Athena
📦 Version: 1.1
💻 Platform: MT5 (5833)
🛠Vendor/Source: MQL5
📈 Strategy: Order grid
⏰ Timeframe: H1
🌍 Currency pairs: XAUUSD
🌓 Trading time: Around the clock
⚠️ Attention: Recommended best VPS, BROker
📊 Monitoring found: MQL5
⏳ Test period: 2023.01.01 – 2026.04.25
🏛 Tick Data Provider: RannForex (MT5)
🧭 GMT: +2; DST: US
Real spread: ✅
Slippage: ❌
📌 All EAs tests EA ForexLab
In order to download an adviser with tests, go to our telegram channel 👇

The retail market is full of gold robots that promise precision, stability, and “smart” automation, yet most reviews still make the same mistake: they compare headline profit without examining how that profit was produced. You can learn about our approach to testing expert advisors on tick history with a real spread on the relevant page – Our principles.
Quantum Athena EA Review: Reading Between the Equity Lines
This Quantum Athena EA review takes a different approach from the dozens of affiliate pages already circulating about this gold robot. Instead of quoting the marketing copy or admiring the smooth equity curve, I extracted all 3,500 individual deals from the MetaTrader 5 backtest report, reconstructed every trade cluster, and identified exactly what is generating the returns.
What I found is a system that is far more dangerous than its statistics suggest. Behind an attractive 81% win rate and a Sharpe ratio of 5.91 sits a grid averaging engine that opened 27 simultaneous positions during a single adverse move in March 2024. The marketing never mentions this. The product description never mentions this. But the trade data makes it unmistakable.
Let’s go through everything — the good, the concealed, and the genuinely concerning.
What Is the Quantum Athena EA?
The Quantum Athena EA is a MetaTrader 5 Expert Advisor developed by Bogdan Ion Puscasu, sold on MQL5.com for $699.99. It was published on April 21, 2026 — making it an extremely new product — and trades exclusively on XAUUSD (Gold vs US Dollar) on the H1 timeframe, though the EA internally manages its own timeframe logic.

The marketing positions it explicitly as “the light version of the legendary Quantum Queen, refined and re-engineered for today’s market conditions.” This lineage is important. The Quantum EA family — including Quantum Queen, Quantum Emperor, Quantum King, and Quantum StarMan — is well known in the retail community, and several of these systems use grid-based position management. Quantum StarMan’s own product page openly states it “utilizes a sophisticated grid system.”
Quantum Athena inherits this DNA. And as the trade data confirms, it is fundamentally a grid system — a fact that materially changes its risk profile compared to how it is marketed.
The backtest analyzed here was run on the RannForex MT5 terminal with 100% real tick history, modeling 493 million ticks across the period January 1, 2023 to April 25, 2026. The history quality is excellent. The period selection, as we will discuss, is not.
Quantum Athena EA Review: The Headline Backtest Numbers
The MetaTrader 5 Strategy Tester reported the following:
| Metric | Value |
|---|---|
| Symbol | XAUUSD (H1) |
| Period | Jan 2023 – Apr 2026 (3.3 years) |
| History Quality | 100% real ticks |
| Initial Deposit | $1,000 |
| Total Net Profit | $2,023.17 |
| Gross Profit | $3,269.43 |
| Gross Loss | -$1,246.26 |
| Profit Factor | 2.62 |
| Recovery Factor | 3.63 |
| Sharpe Ratio | 5.91 |
| Expected Payoff | $1.16 |
| Total Trades | 1,750 |
| Win Rate | 78.69% (reported) / 81.49% (recalculated) |
| Long Trades Won | 78.98% |
| Short Trades Won | 75.00% |
| Largest Profit Trade | $110.68 |
| Largest Loss Trade | -$104.14 |
| Average Profit Trade | $2.37 |
| Average Loss Trade | -$3.06 |
| Balance Drawdown Maximal | $147.11 (7.25%) |
| Equity Drawdown Maximal | $557.59 (27.48%) |
| Z-Score | -3.46 (99.74%) |
At first glance, this looks like an institutional-grade strategy. A Sharpe ratio of 5.91 is exceptional — most professional hedge funds operate with Sharpe ratios between 1 and 2. A recovery factor of 3.63 and profit factor of 2.62 are both solid. The 81% win rate looks reassuring.

But three numbers on this list tell the real story, and they are easy to miss: the gap between balance drawdown (7.25%) and equity drawdown (27.48%), the Z-Score of -3.46, and the 3.3-year period. Each of these is a red flag, and together they reveal the system’s true nature.
The Balance vs. Equity Drawdown Gap: Where the Truth Hides
This is the single most important section of this Quantum Athena EA review, so read it carefully.
The backtest reports two different drawdown figures:
- Balance Drawdown Maximal: $147.11 (7.25%)
- Equity Drawdown Maximal: $557.59 (27.48%)
The balance drawdown measures the decline in realized (closed) account value. The equity drawdown measures the decline in total account value including open, unrealized positions. When these two numbers are close together, a system closes trades cleanly and rarely holds large floating losses. When they diverge dramatically — as here, by nearly 4x — it means the system is holding large baskets of losing positions open and only closing them when they recover.
A 27.48% equity drawdown means that at one point in this backtest, a trader with $1,000 was looking at $557 in combined realized and unrealized losses — more than half their capital tied up in underwater positions waiting to recover. The balance “only” showed a 7.25% decline because the losing positions had not yet been closed and booked.
This is the defining signature of a grid or averaging strategy. The balance curve looks beautiful and smooth because losses are not realized until the grid recovers. The equity curve — the real-time truth of the account — tells a far more violent story.
The 27-Position Grid: Forensic Proof
The product marketing describes “precision” and “intelligent optimization.” The trade data describes something entirely different.
By tracking every position open and close chronologically through the deal log, I determined the maximum number of simultaneously open positions at any point in the backtest:
27 concurrent open positions, peaking on March 14, 2024.
Here is what actually happened during that event. As gold declined from approximately $2,178 toward $2,153 over March 13–14, 2024, the EA opened a cascade of buy positions at progressively lower prices:
- Buy @ $2,178.19
- Buy @ $2,175.52
- Buy @ $2,173.44
- Buy @ $2,171.73
- Buy @ $2,170.01
- Buy @ $2,168.15
- Buy @ $2,166.33
- Buy @ $2,164.41
- Buy @ $2,162.42
- Buy @ $2,159.99
- Buy @ $2,158.21
- Buy @ $2,156.65
- Buy @ $2,153.56
…and more, until 27 positions were open simultaneously. Every position was tagged in the trade comments with grid-step identifiers like [T2/S03] and [T2/S04] — where “S” denotes the grid step level. The EA’s own parameter set even includes InpGridColor=65535, an explicit acknowledgment in the code that this is a grid system.
This is textbook grid averaging: as price moves against the position, open more positions at worse prices, lowering the average entry, and wait for a reversal to close the entire basket in profit. It worked in March 2024 because gold reversed. The fundamental question every buyer must ask is: what happens when gold does not reverse?
Why the 81% Win Rate Is Misleading
A grid system almost always produces a high win rate, and understanding why is essential to evaluating this EA honestly.
When a grid basket eventually closes in profit, every individual position in that basket is recorded as a separate “win” — even the ones that were deeply underwater for days. In the April 29, 2025 cluster, for example, the EA closed 20 positions simultaneously at the same price ($3,328.81). Ten of those closed as small losses and ten as small wins, netting just $15.16 total — but the trade log records 10 wins from that single grid unwinding event.
This is why the win rate of 81% is not evidence of predictive accuracy. It is an arithmetic artifact of grid mechanics. The system wins frequently in small amounts because it refuses to close losing positions until the grid recovers. The losses, when they come, come all at once — as the equity drawdown reveals.
The reported average win of $2.37 versus average loss of $3.06 confirms this. The wins are tiny. The expected payoff of just $1.16 per trade across 1,750 trades is razor-thin. This is not a high-conviction directional strategy — it is a high-frequency profit-harvesting grid that accumulates small gains while warehousing risk in open drawdown.
Quantum Athena EA Review: The 3.3-Year Backtest Problem
The backtest covers January 2023 to April 2026 — approximately 3.3 years. For a gold EA released in 2026, this is a conspicuously short test window, and the reason matters.

The 2023–2026 period was overwhelmingly a gold bull market. Gold rose from roughly $1,800 in early 2023 to above $3,500 by early 2026 — one of the most sustained directional advances in the metal’s history. For a grid system that opens buy positions on dips and waits for recovery, a persistent bull market is the single most favorable possible environment. Every dip eventually recovers because the underlying trend is relentlessly upward.
What the backtest conspicuously excludes:
- 2020’s COVID crash and the violent gold volatility that followed
- 2021–2022’s extended gold consolidation and drawdown, when gold fell from $2,075 to $1,615 — a 22% decline over many months
- Any sustained gold bear market or prolonged sideways regime
A grid system tested only through a bull market is being shown in its best possible light. The 2021–2022 period — when gold spent over a year grinding lower and sideways — is precisely the environment that breaks averaging systems, because the dips do not promptly recover and the grid keeps adding positions into a falling market.
A 3.3-year backtest on a strategy this sensitive to market regime is not sufficient evidence of robustness. It is a curated sample.
The Z-Score Warning: -3.46 (99.74%)
The MT5 report includes a Z-Score of -3.46 with 99.74% confidence. This statistic is frequently overlooked by retail traders, but it is highly informative.
A negative Z-Score indicates that winning and losing trades are not randomly distributed — specifically, that wins tend to follow wins and losses tend to follow losses, in streaks. A Z-Score of -3.46 at 99.74% confidence means there is a statistically significant tendency for the system to produce clusters of consecutive outcomes.
For a grid system, this is exactly what we would expect and exactly what creates danger. When the grid is working (market trending favorably), it produces long streaks of wins. When the grid is caught in an adverse move, it produces clusters of losses as multiple basket positions close together. The streakiness quantified by the Z-Score is the mathematical fingerprint of the concentrated risk events that the smooth balance curve hides.
The maximum consecutive loss event recorded was 10 trades for -$145.71 — and the single largest loss of -$104.14 on February 5, 2026 confirms that when the grid does unwind unfavorably, the damage is concentrated and significant.
Profit Concentration: The 2025 Anomaly
Breaking down net profit by year from the trade data reveals an uneven distribution:
| Year | Trades | Win Rate | Net Profit |
|---|---|---|---|
| 2023 | 416 | 80.3% | $473.59 |
| 2024 | 534 | 79.2% | $486.79 |
| 2025 | 622 | 82.5% | $1,181.64 |
| 2026 (partial) | 178 | 87.6% | $403.30 |
The visual “PL by Year” chart shows 2025 generating nearly $994 — roughly half of the entire backtest profit in a single year. 2025 was the year gold went parabolic, surging from approximately $2,600 to well above $3,000. A grid system buying every dip in a parabolic uptrend is operating in its ideal environment, and the results reflect that.

The concern is straightforward: the strategy’s profitability is heavily dependent on the specific market conditions of 2025. In years with less directional momentum (which 2023 and 2024 partially represent, with roughly $475–$487 net each), the returns are far more modest. And in a genuine bear market — entirely absent from this backtest — a dip-buying grid faces existential risk.
Entry Timing: A Concerning Concentration
The “Entries by hours” chart reveals that the EA concentrates the vast majority of its position openings in a narrow window: hours 19, 22, and 23 (server time), with hour 22 showing over 540 entries. There is also a secondary cluster around hours 3–4.

This is significant for a gold grid system. Hours 22–23 server time typically correspond to the late US session rollover and the thin-liquidity window before the Asian session fully engages. During these hours:
- Spreads on XAUUSD widen substantially, even on ECN brokers
- Liquidity is reduced, increasing slippage on grid entries
- The daily swap/rollover is charged, and grid systems holding many open positions accumulate substantial financing costs


The backtest confirms the swap impact: across the full test, the system paid -$314.49 in swap charges and -$207.66 in commissions — a combined $522.15 in costs, equal to roughly 26% of the entire net profit. On a live account with wider real-world spreads during these thin hours, these costs would be materially higher, directly eroding the thin $1.16 per-trade expected payoff.
The “Quantum Queen Light” Lineage: What It Tells Us
Marketing the Quantum Athena as a “light version of the legendary Quantum Queen” is a deliberate positioning choice, and it carries information.
The Quantum Queen and related Quantum family EAs have generated mixed long-term results in the retail community. Grid-based gold systems within this family have, in various forms, experienced significant drawdowns and account losses when gold conditions turned unfavorable. The “light” designation suggests reduced grid aggression — fewer maximum positions, smaller step sizes, or tighter risk parameters — but the fundamental architecture remains grid-based, as the 27-position March 2024 event proves.
A “lighter” grid is still a grid. It defers and conceals risk in the same way; it simply may take a larger or more sustained adverse move to trigger catastrophic loss. The core vulnerability — that the system can accumulate a large basket of losing positions with no realized stop-loss until the market recovers — is unchanged.
The Long-Short Imbalance: 93% Long
The trade distribution shows an extreme directional bias: 93% long trades versus 7% short trades.


In a backtest period that was overwhelmingly a gold bull market, a 93% long bias is essentially a leveraged bet on gold continuing to rise. This is not a market-neutral or adaptive strategy — it is a system structurally positioned for one direction, validated against a period in which that direction was correct.
If gold enters a sustained downtrend, a 93%-long grid system faces the worst possible scenario: repeatedly buying into a falling market, accumulating ever-deeper baskets of losing long positions, while its minimal 7% short exposure provides almost no offsetting protection. The backtest cannot show this risk because the test period contained no such downtrend.
Risk Management Reality: What $699.99 Actually Buys
Let’s assess what a buyer is actually getting for the $699.99 price tag.
The position sizing: The backtest used InpLotsFixed=0.01 with auto-lot calculation tied to balance (InpAutoLotsValue=3, InpLotsFixedBalance=500.0). This means on a $1,000 account, the EA traded micro-lots. At larger account sizes or more aggressive auto-lot settings, the grid’s position count of 27 simultaneous trades would scale proportionally — and so would the equity drawdown. A 27.48% equity drawdown at 0.01 lot becomes the same percentage at larger sizes, but the dollar exposure multiplies.
The concealed leverage: With up to 27 open positions, the effective market exposure at the grid’s peak is 27x the nominal single-position size. The 1:500 leverage used in the backtest provides the margin headroom for this, but it also means a sufficiently large adverse gold move could trigger a margin call before the grid has a chance to recover.
The thin edge: An expected payoff of $1.16 per trade, with $522 of the $2,023 profit consumed by swap and commission, leaves a genuinely thin net edge. Any degradation in live execution — wider spreads, slippage on the thin-hour entries, higher real swap rates — could compress this edge significantly.
Quantum Athena EA Review: Professional Pre-Deployment Checklist
For any trader seriously considering this EA, here is the due-diligence checklist:
1. Understand that this is a grid system, not a precision strategy. Regardless of marketing language, the trade data confirms grid averaging with up to 27 concurrent positions. Price it as a grid system, with all the tail-risk that implies.
2. Focus on the equity drawdown, not the balance drawdown. The relevant risk number is 27.48%, not 7.25%. The balance curve’s smoothness is an artifact of deferred loss realization. Plan your capital around the equity figure.
3. Recognize the backtest excludes the conditions that break grids. The 2023–2026 period was a gold bull market. The 2021–2022 sideways/down period and the 2020 crash are absent. You have no data on how this system behaves in the conditions most dangerous to it.
4. Account for the swap and commission drag. $522 of costs against $2,023 profit is 26% of gross. On a live account with realistic spreads during the thin-liquidity entry hours this EA favors, expect higher costs.
5. Be cautious of the 93% long bias. This system is structurally a leveraged long-gold position. If your market thesis includes any probability of a sustained gold downtrend, this EA is positioned against you.
6. The product is brand new (April 2026). There is minimal live track record. The linked MQL5 signal should be examined critically for total duration, real drawdown, and whether it has operated through any adverse gold conditions — which, given gold’s 2025–2026 trajectory, it almost certainly has not.
7. Test at minimum position size for at least 6 months across varied conditions. A grid system must be observed through at least one significant adverse move before any capital scaling. Do not let a smooth opening few weeks create false confidence.
Final Verdict: Quantum Athena EA Review Without the Marketing Gloss
The Quantum Athena EA is a competently constructed grid system with genuinely strong backtest statistics under favorable conditions. Its 100% real-tick MT5 backtest methodology is rigorous, its win rate is high (as grid systems’ win rates always are), and its performance during the 2023–2026 gold bull market was legitimately profitable on paper.
But the honest assessment cannot end with the surface statistics.
This is a grid averaging system that opened 27 simultaneous positions during a single adverse move, that carries a 27.48% equity drawdown concealed behind a 7.25% balance drawdown, that was tested only across a 3.3-year gold bull market while excluding the sideways and bear conditions that destroy grid strategies, and that is structurally 93% long on an instrument it bets will keep rising. The Z-Score of -3.46 quantifies the streaky, concentrated nature of its risk. And $522 of its $2,023 profit was consumed by trading costs.
The Quantum family heritage — explicitly grid-based — is the most honest description of what this EA is. The “precision” and “intelligent optimization” framing in the marketing obscures the mechanical reality that the trade data lays bare.
For beginner traders: A high win rate means almost nothing when it comes from a grid system. The 81% figure is arithmetic, not accuracy. Understand that grids defer losses rather than avoid them.
For intermediate traders: The balance-vs-equity drawdown gap is the most important metric on the report. Whenever you see a 4x divergence between those two numbers, you are looking at a system that warehouses risk in open positions. That is the number that can blow your account.
For experienced algorithmic traders: A grid tested exclusively through a bull market, with a -3.46 Z-Score, 27 max concurrent positions, and a 93% long bias, is a regime-dependent bet on gold continuing to rise. Without a backtest spanning 2020–2022 and a verifiable live account through adverse conditions, the $2,023 profit is not evidence of robustness — it is evidence of favorable timing.
Grid systems can be profitable for extended periods. They are also responsible for a disproportionate share of catastrophic retail account losses, precisely because they look flawless right up until the move that breaks them. The Quantum Athena EA has not yet faced that move in any data available to a prospective buyer.
Trade with your eyes open.
Even more advisors with test results are presented in our advisor database.
In order to download an adviser with tests, go to our telegram channel 👇