


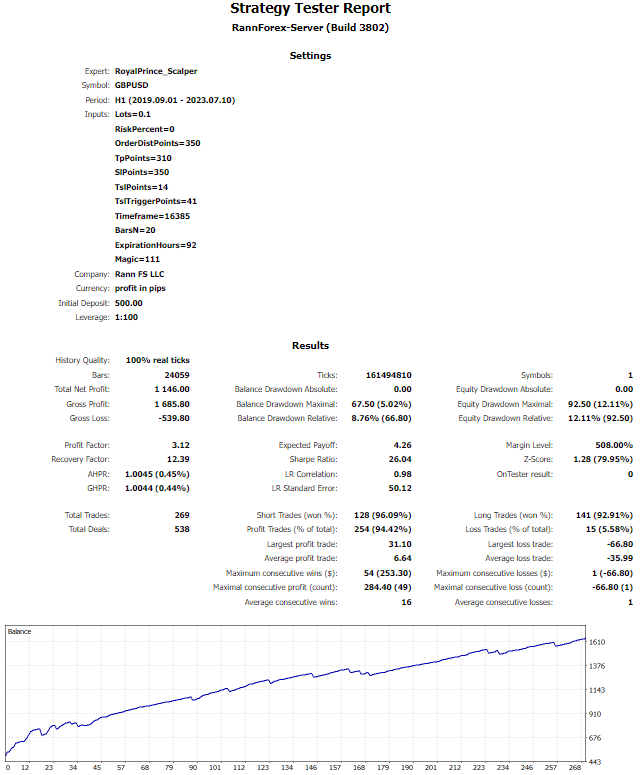
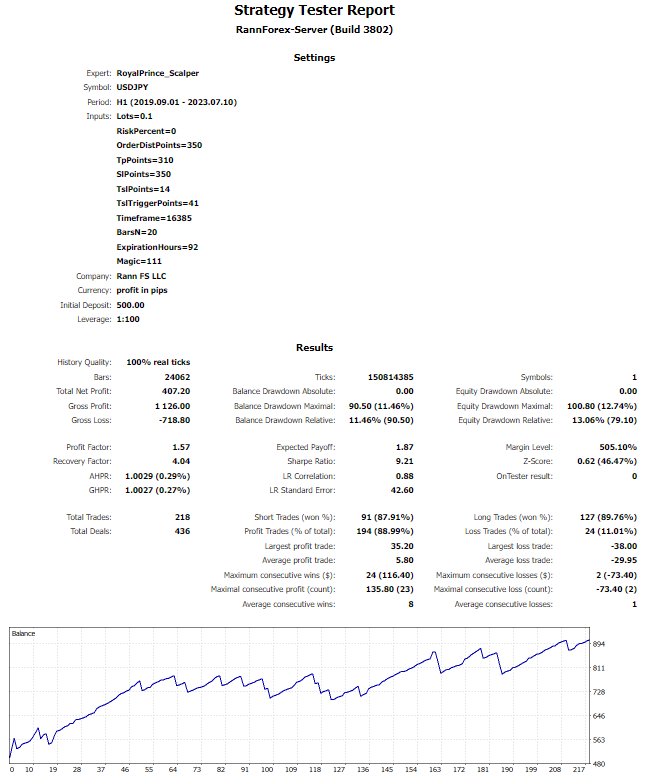
We tested RoyalPrince Scalper as two separate MetaTrader 5 Strategy Tester runs, GBPUSD and USDJPY, both on H1 from September 2019 to July 2023 on 100% real ticks. Both finished positive: GBPUSD at +1,146.0 pips with a 3.12 Profit Factor, USDJPY at +407.2 pips with a 1.57 Profit Factor. We then ran the EA forward on our own Darwinex demo and published the account on Myfxbook. Over 30 trades that sample lost 89.1 pips at a 0.50 Profit Factor.
The tested configuration used a fixed 0.10 lot, one market position at a time and two-sided pending-stop entries. Most profitable trades closed after the stop had moved into profit, leaving a payoff dominated by small winners and less frequent, much larger losses. At the observed average win and loss, GBPUSD and USDJPY both remained above their break-even win rates in the historical tests. Our Darwinex demo sample did not. The comparison below quantifies that difference from the underlying trade records.
Key Findings
- Two fixed-lot (0.10) H1 backtests on 100% real ticks: GBPUSD PF 3.12, USDJPY PF 1.57.
- Every market entry came from a pending stop order; one market position open at a time.
- Most winners closed through an actively moved (trailing) stop, not the nominal take-profit: 96.1% of GBPUSD winners and 99.0% of USDJPY winners were stop-labelled exits.
- The average loss was roughly five to six times the average win; the observed payoff implied break-even win rates of 84.43% on GBPUSD and 83.77% on USDJPY.
- Historical P/L was concentrated in short-duration trades: positions held longer than ten minutes were net −11.4 pips on GBPUSD, while positions held longer than five minutes were net −181.5 pips on USDJPY.
- Our Darwinex demo forward sample (30 trades) ran at 80% wins, a 0.50 Profit Factor and roughly −3 pips of expectancy.
- The current MQL5 listing documents v1.50 on M5–M15; our H1 reports end in July 2023 and expose no EA version, so v1.50 is later product context, not the tested binary.
What We Tested
Both reports come from the MetaTrader 5 Strategy Tester on RannForex-Server (Build 3802), tested on H1 over 2019.09.01–2023.07.10 at 100% real-tick history quality. The inputs match across pairs: Lots=0.1, RiskPercent=0, OrderDistPoints=350, TpPoints=310, SlPoints=350, TslPoints=14, TslTriggerPoints=41, BarsN=20, ExpirationHours=92, Magic=111, on a 500.00 deposit (report units) at 1:100. The reports establish RannForex-Server and 100% real ticks; they do not name a separate tick-data provider, GMT offset or DST rule, so we do not attribute one. Our general approach to these runs is set out in our testing methodology.
| Metric | GBPUSD H1 | USDJPY H1 |
|---|---|---|
| Period | 2019-09-01 to 2023-07-10 | 2019-09-01 to 2023-07-10 |
| Trades | 269 | 218 |
| Net P/L | +1,146.0 pips | +407.2 pips |
| Profit Factor | 3.12 | 1.57 |
| Expected payoff | +4.26 pips | +1.87 pips |
| Win rate | 94.42% | 88.99% |
| Balance Maximal DD (value / %) | 67.50 / 5.02% | 90.50 / 11.46% |
| Balance Relative DD (% / value) | 8.76% / 66.80 | 11.46% / 90.50 |
| Equity Maximal DD (value / %) | 92.50 / 12.11% | 100.80 / 12.74% |
| Equity Relative DD (% / value) | 12.11% / 92.50 | 13.06% / 79.10 |
| Average win / loss | +6.64 / -35.99 pips | +5.80 / -29.95 pips |
| Fixed lot | 0.10 | 0.10 |
Unit note: both MT5 reports use Currency: profit in pips. QuantAnalyzer applies generic $ or money labels to some exported charts, so the vertical values in those images should be read as the report’s pip-based units rather than US-dollar P/L.
How RoyalPrince Scalper Entered and Exited Trades
Every completed trade in both ledgers began as a pending stop order, and only one market position was ever open at a time. On GBPUSD, 712 stop orders were placed (359 buy, 353 sell); 269 filled, 442 expired and 1 was cancelled, a fill rate near 37.8%. USDJPY placed 667 (329 buy, 338 sell); 218 filled, 448 expired and 1 cancelled, near 32.7%. At most two pending orders sat active at once — one buy stop and one sell stop bracketing price. Sizing never changed: all 269 GBPUSD and all 218 USDJPY entries were 0.10 lot, with no escalation after losses.
| Metric | GBPUSD | USDJPY |
|---|---|---|
| Fixed lot | 0.10 | 0.10 |
| Max market positions at once | 1 | 1 |
| Pending-stop placements | 712 | 667 |
| Pending fill rate | ~37.8% | ~32.7% |
| Profitable SL-labelled exits | 244 | 192 |
| TP exits | 10 | 2 |
| P/L, ≤5 min holds | +1,027.5 pips | +588.7 pips |
| P/L, >5 min holds | +118.5 pips | -181.5 pips |
| P/L, >10 min holds | -11.4 pips | -156.6 pips |
| P/L, >1 hour holds | -123.0 pips | -369.6 pips |
Duration note: the holding-time rows in this table are overlapping thresholds, not separate buckets. For example, trades held longer than one hour are also included in the >10-minute and >5-minute rows. Do not add these rows together.
An sl-tagged close in MT5 records execution at the stop level; it does not identify the trade as a loss. On GBPUSD, 259 of 269 exits were stop-labelled and 244 of those closed in profit; only 10 trades reached the nominal take-profit. On USDJPY, 216 of 218 exits were stop-labelled, including 192 profitable closes, while only 2 trades reached take-profit. In the observed ledgers, 96.1% of GBPUSD winners and 99.0% of USDJPY winners were therefore closed at a stop level rather than the TpPoints=310 target.
One GBPUSD trade makes this visible in the ledger. A buy stop around 1.23534 carried an initial stop near 1.23184 and a target near 1.23844. The position later closed through its stop around 1.23603–1.23605, above the entry, and finished positive. For our analysis, every sl row is therefore checked against its realized P/L rather than classified by the exit label alone. The inputs TslPoints=14 and TslTriggerPoints=41 support the presence of active stop management, but they do not expose the internal trailing formula. Historically, this produced many small profitable stop exits, which is consistent with average winners of only about 5–7 pips despite a nominal ~31-pip target.
The High Win Rate Needs the Payoff Context
Win rate alone does not describe the payoff. On GBPUSD, the average winner was +6.64 pips against an average loss of −35.99; on USDJPY, +5.80 against −29.95. The average loss was roughly five to six times larger than the average win. At those observed average sizes, the break-even win rate was 84.43% on GBPUSD and 83.77% on USDJPY.
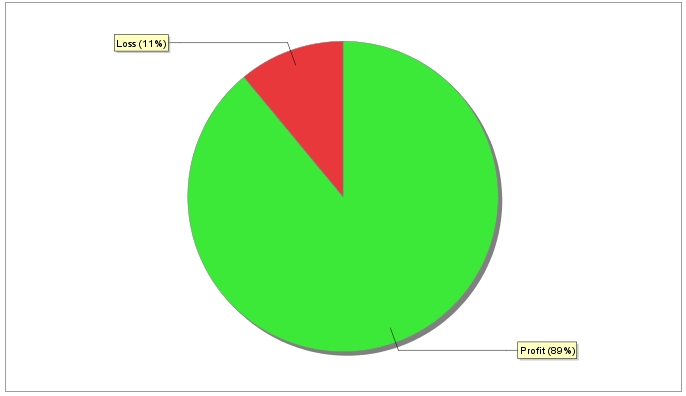
Measured against those thresholds, GBPUSD ran about 10.0 percentage points above break-even at a 94.42% win rate, while USDJPY ran 5.22 points above it at 88.99%. The larger margin on GBPUSD is consistent with its higher Profit Factor of 3.12; USDJPY operated closer to its break-even threshold and finished at 1.57. If the observed average win and loss were held unchanged, expectancy reaches zero near 84.4% on GBPUSD and 83.8% on USDJPY. This is a sensitivity calculation, not a forecast or a proposed tuning target.
Where the Historical Profit Came From
Holding-time attribution shows that most of the historical P/L was generated by short-duration trades.
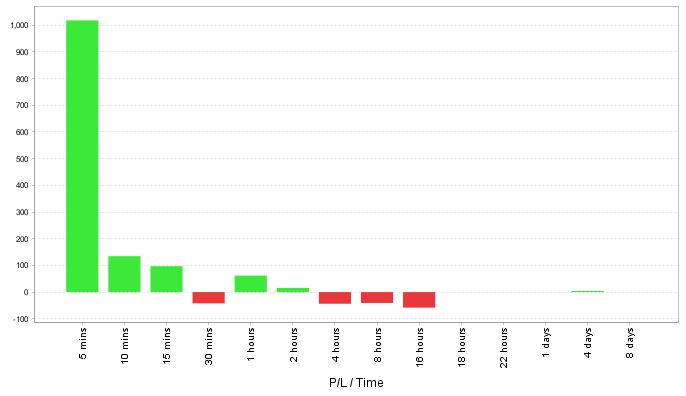
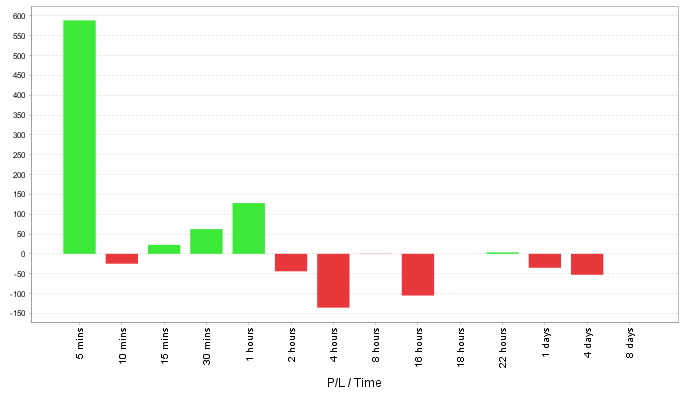
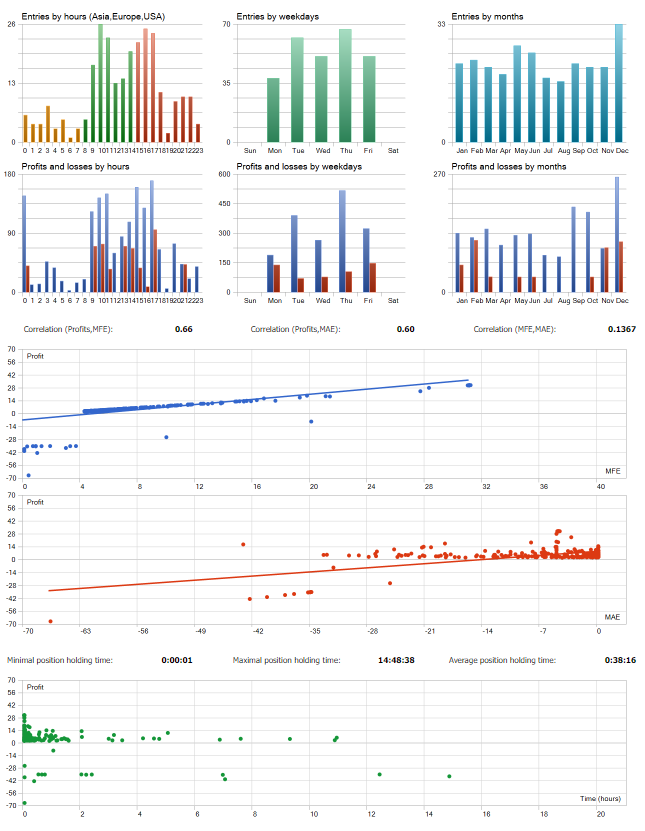
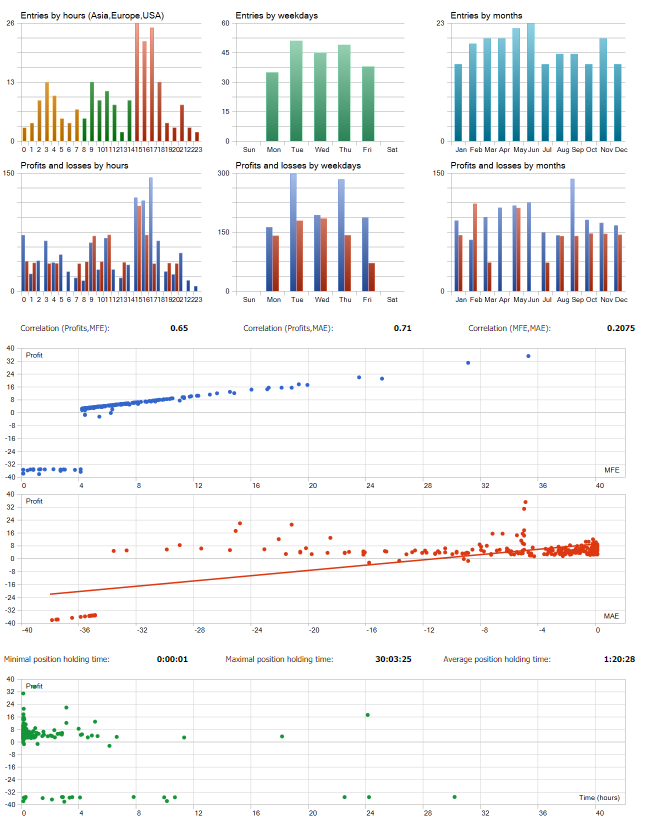
On GBPUSD, trades closed within five minutes contributed +1,027.5 pips. Trades held longer than five minutes added +118.5 pips in aggregate, but the subset held longer than ten minutes was slightly negative at about −11.4 pips, and positions held beyond an hour totalled about −123.0 pips. On USDJPY, the ≤5-minute group contributed +588.7 pips while trades held longer than five minutes totalled about −181.5 pips. The per-trade distribution below shows the same small-winner / larger-loss structure across holding durations.
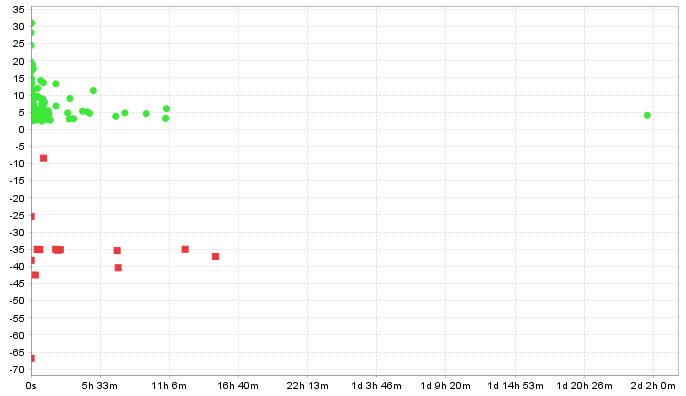
These figures do not establish a time-based exit rule. The duration buckets use calendar elapsed time, so a position carried across a weekend can appear in a multi-day bucket even though the tester reports a maximum market-time holding of 14:48:38 on GBPUSD and 30:03:25 on USDJPY. A GBPUSD position opened on Friday 2 September and closed on Monday 5 September 2022 is one example. More importantly, closing trades mechanically after five or ten minutes would alter the strategy path; we did not run that counterfactual test.
Hour and Weekday Attribution
Both ledgers contain market entries across all 24 server hours. The tested configuration therefore does not support the site’s existing Night session classification. We treat the charts below as historical attribution by server hour and weekday only; the reports do not establish the server timezone, so we do not assign Asian, London or New York session labels.
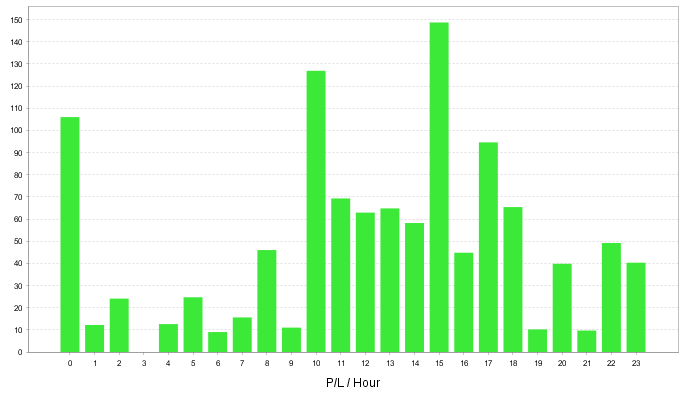
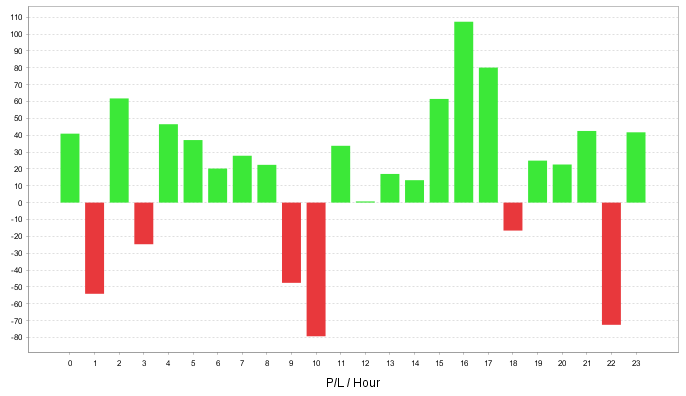
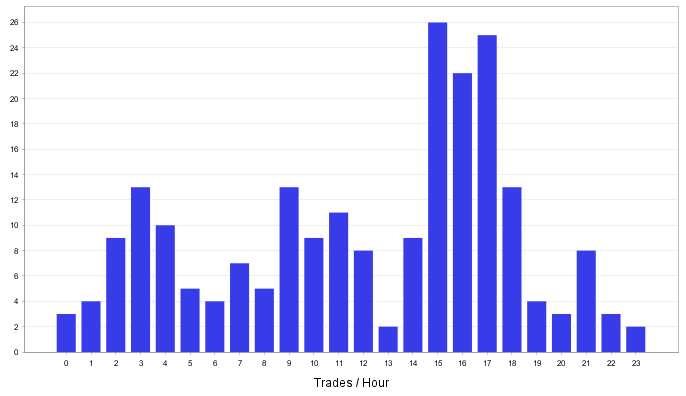
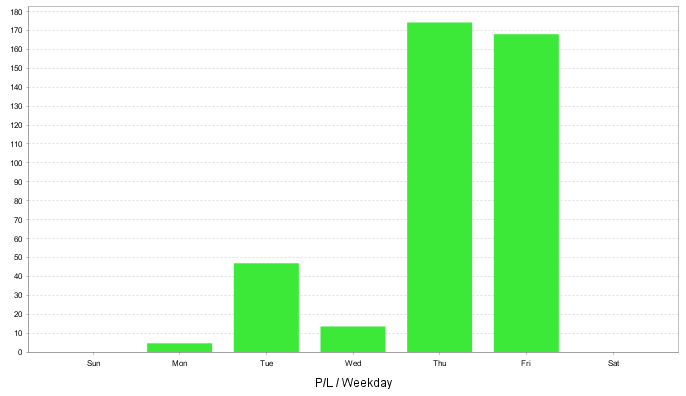
These are attributions of where the historical trades happened to fall, not a filter we applied and retested. We are not proposing that trading only the positive hours or only Thursday and Friday would reproduce the rest of the result.
Year-by-Year Result
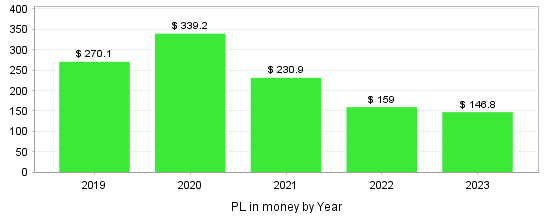
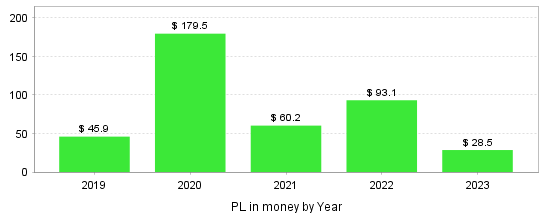
Every displayed calendar segment was positive on both pairs. The 2019 and 2023 values cover partial years, so they are not directly comparable with the complete 2020–2022 periods. USDJPY produced smaller yearly totals than GBPUSD across the displayed history, consistent with its lower overall expectancy and Profit Factor in this test.
Equity and Drawdown
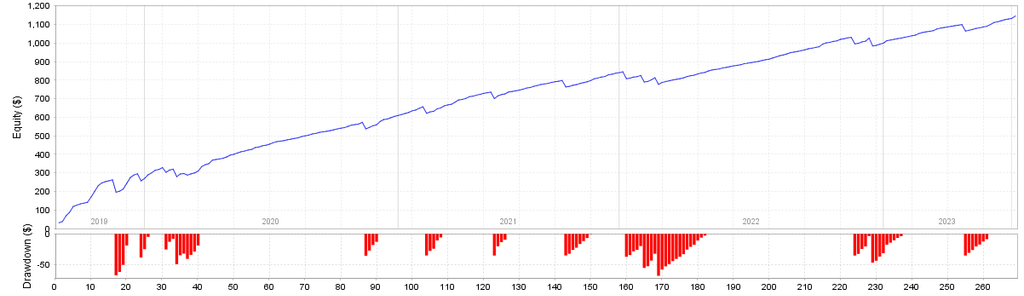
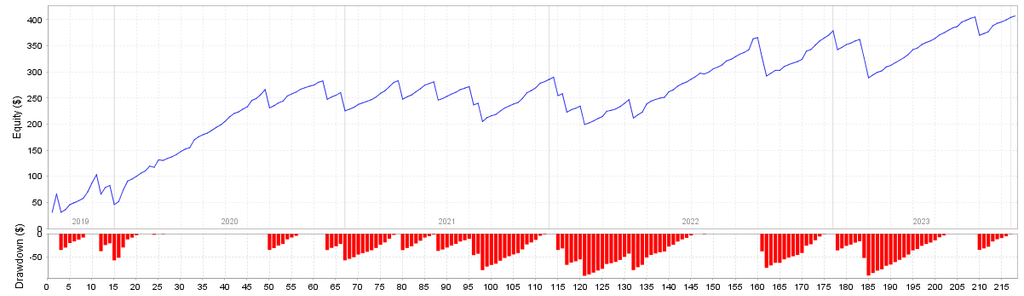
The reports expose separate balance and equity drawdown fields. On GBPUSD, Balance Maximal Drawdown was 67.50 / 5.02%, Balance Relative Drawdown 8.76% / 66.80, Equity Maximal Drawdown 92.50 / 12.11%, and Equity Relative Drawdown 12.11% / 92.50. On USDJPY, the corresponding figures were 90.50 / 11.46%, 11.46% / 90.50, 100.80 / 12.74%, and 13.06% / 79.10. Balance drawdown tracks changes in closed balance, while equity drawdown also reflects floating P/L. We keep MT5’s Maximal and Relative fields separate rather than comparing their monetary values as if they were the same measure.
Our Darwinex Demo Forward Test
We deployed RoyalPrince Scalper on a Darwinex demo (MT5, USD, 1:200, $1,000) and published it on Myfxbook as our RoyalPrince Scalper forward monitor. As last displayed (updated 5 April 2024), the account stood at $891.65, a −10.83% result with an 18.14% drawdown across 30 trades — −89.1 pips in total. The average winner was +5.19 pips ($4.55) and the average loser −35.60 pips (−$36.28); 24 of 30 trades won (80%), average hold 3h13m, Profit Factor 0.50, expectancy about −3 pips per trade.
The forward sample retained a similar payoff asymmetry: the average winner remained small and the average loss remained several times larger. Its observed win rate, however, was lower than in either historical test. We examine the resulting expectancy below. For the broader reasons a historical result can diverge from deployed trading, see why backtests fail in live trading; our separate methodology note explains why forward testing matters.
Why the Forward Sample Turned Negative
The backtest-to-forward difference becomes clearer when each sample’s win rate is compared with the break-even threshold implied by its own average winner and average loser.
| Metric | GBPUSD backtest | USDJPY backtest | EA ForexLab Darwinex demo |
|---|---|---|---|
| Trades | 269 | 218 | 30 |
| Win rate | 94.42% | 88.99% | 80.00% |
| Avg win | +6.64 pips | +5.80 pips | +5.19 pips |
| Avg loss | -35.99 pips | -29.95 pips | -35.60 pips |
| Break-even WR | 84.43% | 83.77% | ≈87.28% |
| Margin vs break-even | +9.99 pp | +5.22 pp | ≈-7.28 pp |
| Expected P/L per trade | +4.26 pips | +1.87 pips | -3.0 pips |
| Profit Factor | 3.12 | 1.57 | 0.50 |
Calculation note: Break-even win rate is calculated from the observed average winner and average loser in each sample. For the Darwinex forward sample, the calculation uses Myfxbook’s displayed pip averages and excludes the separately reported $18.74 commission, so it is a pre-commission pip-P/L threshold. The forward figures cover 30 trades and describe that deployed sample, not a long-run estimate.
Using the forward sample’s own averages, the win rate it needed to break even was:
break-even WR = 35.60 / (35.60 + 5.19) ≈ 87.28%
expectancy = 0.80 × 5.19 − 0.20 × 35.60 ≈ −2.97 pips/trade
Using the displayed pip averages, the observed 80% win rate sat about 7.28 percentage points below the approximately 87.28% pre-commission break-even level. Using the sample’s own average winner and average loser gives an expectancy of about −2.97 pips per trade, closely matching the approximately −3.0 pips displayed by Myfxbook. No additional assumption is needed to explain the negative expectancy mathematically: in this sample, the observed win rate was below the break-even level implied by its payoff.
The forward evidence covers 30 trades. It records what happened in that deployed account over the observed period; it is not a long-run estimate of the EA’s forward win rate. We also do not treat the monitor as a strict same-binary, same-settings replay of either H1 backtest unless an archived file confirms exact identity.
Current MQL5 Version and Test Identity
The current MQL5 listing documents version 1.50, updated in August 2024, and describes M5–M15 operation with broker-specific optimisation and an emphasis on low spread, slippage and latency. The v1.50 notes state that risk=0 uses fixed lots, which is consistent with the fixed 0.10-lot behaviour in our reports but does not establish binary identity.
Our uploaded reports are H1 tests ending in July 2023 and expose no EA version. We therefore treat the MQL5 page as later product context, not as proof that the tested file was v1.50 or that the current M5–M15 time/news/equity features were present in what we ran.
Execution Costs, Small Winners and Forex Rebates
RoyalPrince Scalper’s average winners were small in every sample we analysed: +6.64 pips on GBPUSD, +5.80 on USDJPY and +5.19 in our forward monitor. With that payoff profile, spread and commission consume a larger share of a typical winning trade than they would in a strategy targeting much larger moves. The current MQL5 listing also identifies low spread, slippage and latency as important execution conditions.
Our Darwinex monitor separates trading P/L from transaction cost. The sample’s pip result was already negative at −89.1 pips, while Myfxbook separately recorded $18.74 in commissions on 3.00 lots — approximately $6.25 per traded lot, or $0.62 per closed trade. Profit is probabilistic; trading costs are deterministic. ForexLAB Rebate can reduce eligible transaction-cost drag; it cannot change the −89.1-pip trading result or the win-rate/payoff relationship that produced it.
ForexLAB Rebate returns part of broker-partner revenue to eligible accounts based on confirmed trading volume. The broker’s normal spreads, commissions and execution conditions remain unchanged, and rebate accrual does not depend on whether an individual trade wins or loses. It can reduce eligible deterministic transaction cost. It cannot restore the missing win-rate margin observed in this sample, change the entry signal or loss size, move the break-even threshold, remove slippage or latency, or alter future trading outcomes.
Commercial disclosure: ForexLAB Rebate is operated by EA ForexLab. We include it here because RoyalPrince Scalper’s small-winner payoff and our forward monitor provide directly observed commission and trading-volume data. Rebate is treated as transaction-cost control and is separate from our analysis of the strategy’s trading logic.
Check supported brokers and current ForexLAB Rebate rates →
What the Evidence Shows
The two historical tests show a fixed-lot pending-stop scalper that closed most winning trades quickly at relatively small profits. GBPUSD finished with a 94.42% win rate, about 10.0 percentage points above its calculated break-even level, and a 3.12 Profit Factor. USDJPY finished 5.22 points above its break-even level with a 1.57 Profit Factor. In our Darwinex demo sample, the average winner and average loser remained similar in scale to the historical payoff, while the observed win rate was 80%. With a +5.19-pip average winner and a −35.60-pip average loss, that sample required about 87.3% winners to break even; Myfxbook reported approximately −3 pips of expectancy and a 0.50 Profit Factor. These records establish how the tested H1 configurations and our deployed demo sample behaved. They do not establish the behaviour of the later MQL5 v1.50 or a separately optimised M5/M15 configuration. The 30-trade forward monitor remains a deployed sample rather than a long-run estimate. RoyalPrince Scalper is also listed in our Forex EA database.
In order to download an adviser with tests, go to our telegram channel:
