


Adapt EA — key findings from our tests
- 4 MT4 backtests, 8,765 trades total, across USDCAD, AUDUSD, EURGBP and USDJPY.
- All four 2020–2024 runs finished profitable — Profit Factor 2.11–2.90.
- Reported Relative Drawdown ranged from 24.62% to 46.83%.
- Input
ManualLot=0.01, but individual entries eventually reached 1.36–2.56 lots. - Same-direction baskets reached up to 10 open positions at once.
- Tested configuration ran with
AutoSettings=0— the manual parameter block, not the automatic mode. - ~510.94 lots of closed volume across the four separate tests.
- Darwinex historical ticks via Tick Data Suite v2, real/variable spread, slippage not modeled.
We tested the Adapt EA file on USDCAD, AUDUSD, EURGBP and USDJPY, all on H1, using MetaTrader 4 with Darwinex historical ticks through Tick Data Suite v2 and real, variable spread. Across 8,765 trades, every run finished strongly positive, with Profit Factor between 2.11 and 2.90. Those headline numbers are impressive. The order ledgers are where the interpretation changes.
When we followed the trades in sequence, the same-direction averaging baskets became clear. Position size increased geometrically inside recovery sequences — typically 0.01 → 0.01 → 0.02 → 0.04 → 0.08 and beyond — with the deepest individual entry in our tests reaching 2.56 lots. Reported Relative Drawdown ranged from 24.62% to 46.83%. The reported historical results are clearly positive, but they were produced by a grid/recovery structure with much more variable exposure than the older low-risk description suggested. That mechanism is the central subject of this review.
Scope note: this article covers the historical Adapt EA configuration we tested on 2020–2024 data. Current releases may use different code, settings or risk logic, so we do not assume that a current Adapt EA build is identical to the file analyzed here.
What we tested
Four separate Strategy Tester reports, one per pair, each starting from a 1,000 deposit and each run independently. The tested item identifies itself in every report as Adapt EA. Shared conditions across all four:
- Platform: MetaTrader 4, terminal build 1420. This is the MT4 build number, not the EA version — worth stating plainly because the two often get confused.
- Timeframe: H1.
- Window: roughly 2020-01-01 to 2024-07-10.
- Model: Every tick, 99.90% modelling quality, 0 mismatched chart errors.
- Spread: variable (real spread), consistent with our standard tick-data testing methodology.
- Slippage: not modeled.
One provenance detail is easy to misread on these reports, so we want to be exact about it. We used Darwinex historical tick data through Tick Data Suite v2 (GMT+2, US DST). The MT4 report header shows ICMarketsSC-Demo06 — that is the account and symbol specification the tester ran against, not the source of the tick data. Those are two different roles, and we are not implying that IC Markets supplied the historical ticks.
The visible input block was the same on all four reports:
AutoSettings=0; MaxDrawDown=30; Slippage=10; Magic=32835832;
SignalAccuracy=2; SignalFrequency=6; SignalPeriodCoef=3;
ManualLot=0.01; TakeProfit=50; OrdersStep=50; IncreaseEach=0;
IncreaseTakeProfit=5; IncreaseOrdersStep=5; StopGridOn=9; StopLossLastOrder=50;
Three of those inputs carry more meaning than they look like they do, and each one quietly contradicts a comfortable reading of the old marketing copy:
AutoSettings=0. The EA’s input comments separate an “Auto Settings” group from a “Manual Settings” group. Our four tests ran the manual block. These reports therefore validate only the configuration we actually tested; they do not establish how a separate automatic-settings mode would perform.
MaxDrawDown=30. It is tempting to read this as a hard 30% ceiling. The reports don’t support that. Whatever the parameter governs internally, MT4’s reported Relative Drawdown came in above 30% on three of the four pairs: AUDUSD 24.62%, USDJPY 33.30%, EURGBP 41.61% and USDCAD 46.83%. We would not describe MaxDrawDown=30 as a guaranteed cap on the drawdown the report shows.
Slippage=10. This is an EA input, not a simulation setting. Our test record has execution slippage as not modeled, so the presence of Slippage=10 in the parameter list is not evidence that adverse fills were simulated. For a strategy that fills a lot of orders, that distinction is not a footnote — it is part of the risk.
A quick terminology note we hold to throughout: we quote the report’s own Relative Drawdown field rather than calling anything an “equity drawdown.” The standard MT4 summary here doesn’t give us a separately labelled floating-equity metric, and for a grid/recovery EA the floating exposure inside an open basket can be larger than the closed-trade drawdown line suggests. So when we say 46.83%, we mean the report’s Relative Drawdown, and we don’t claim that number fully captures intrabasket floating risk.
Four backtests at a glance
Here are the four reports side by side. Each ran on its own 1,000 deposit, so the returns are per-test, not a combined portfolio — please don’t add the four percentages together into one number, because nothing in these tests was traded as a single account.
| Pair | Trades | Net return | Profit Factor | Profit-trade rate | Expected Payoff | Relative Drawdown | Largest win | Max observed lot |
|---|---|---|---|---|---|---|---|---|
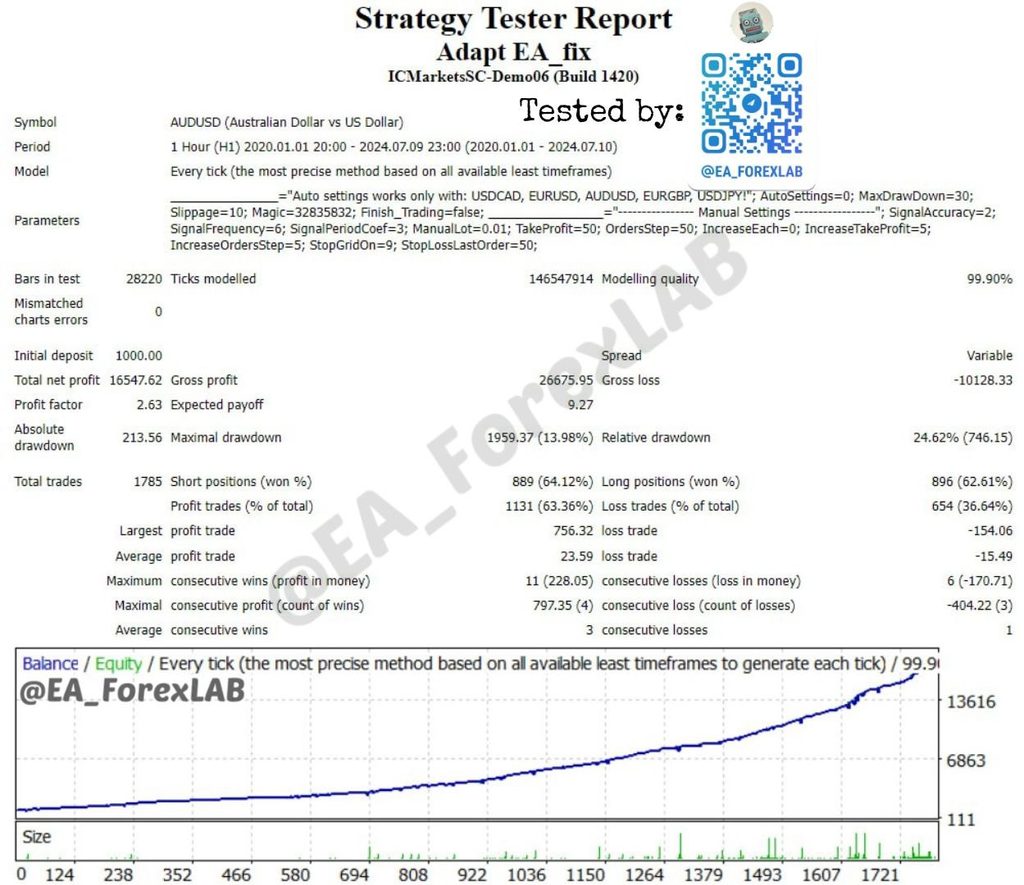
| AUDUSD | 1785 | +1654.76% | 2.63 | 63.36% | 9.27 | 24.62% | +756.32 | 1.60 |
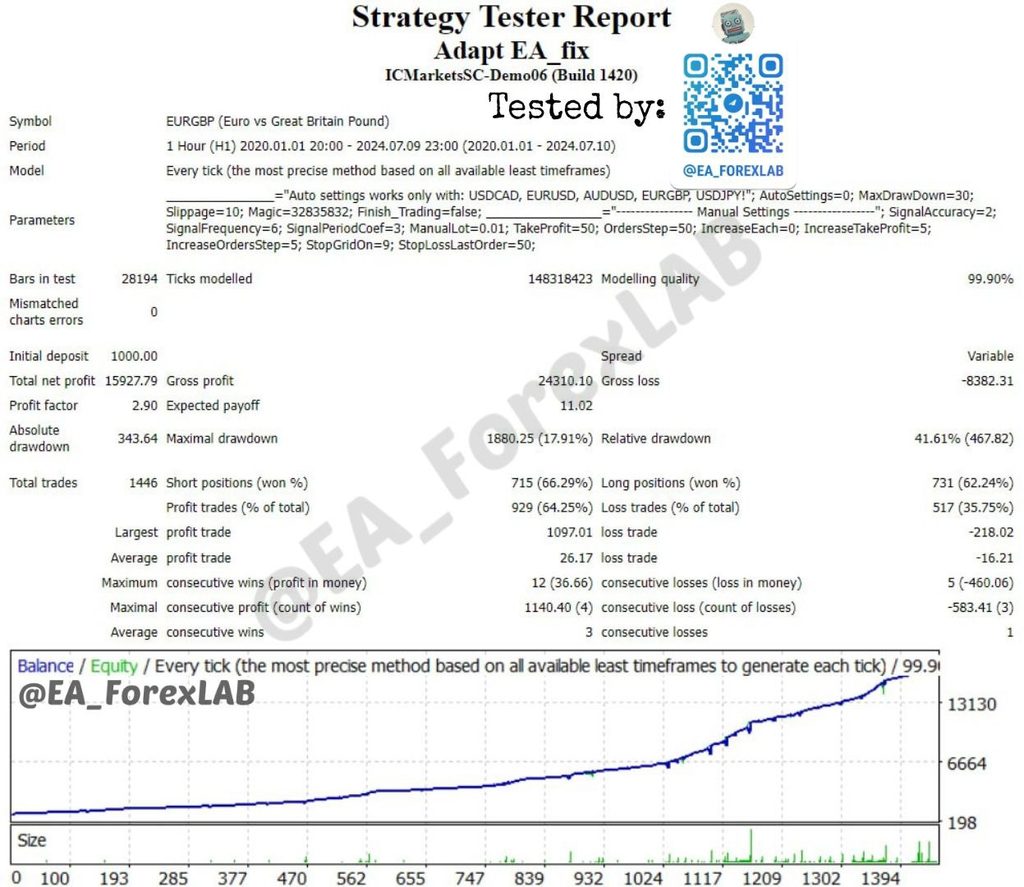
| EURGBP | 1446 | +1592.78% | 2.90 | 64.25% | 11.02 | 41.61% | +1097.01 | 1.36 |
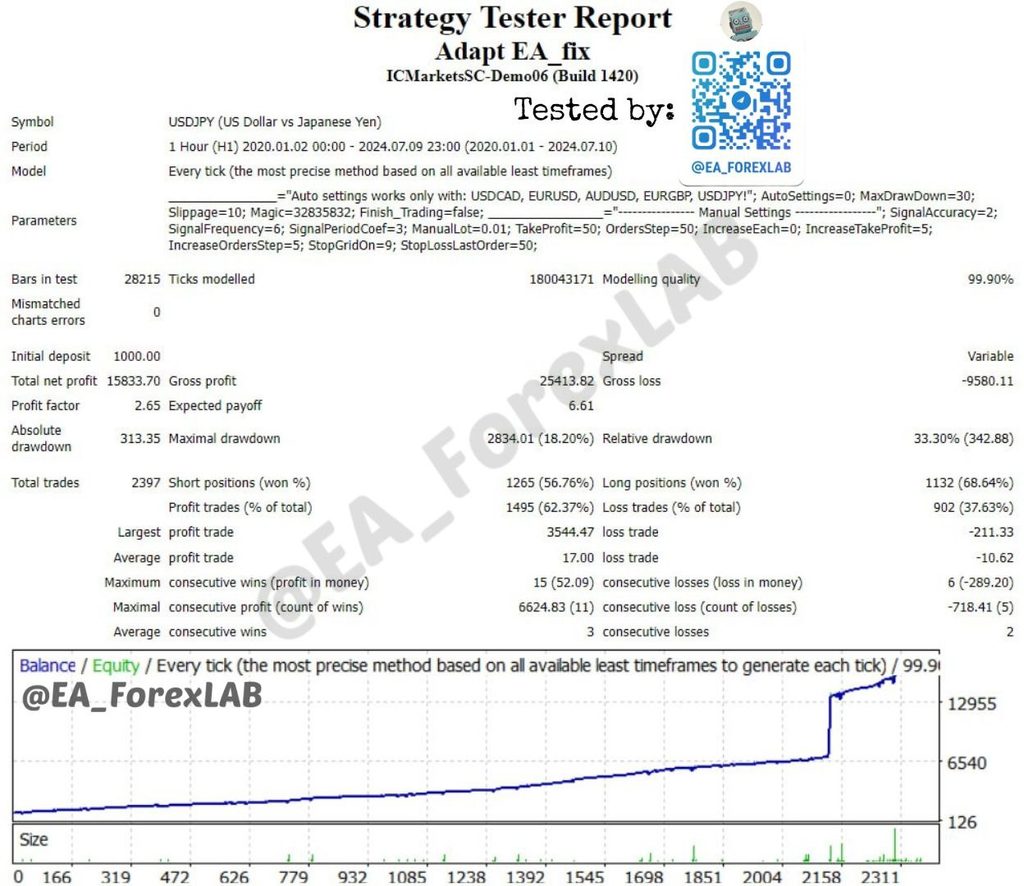
| USDJPY | 2397 | +1583.37% | 2.65 | 62.37% | 6.61 | 33.30% | +3544.47 | 2.56 |
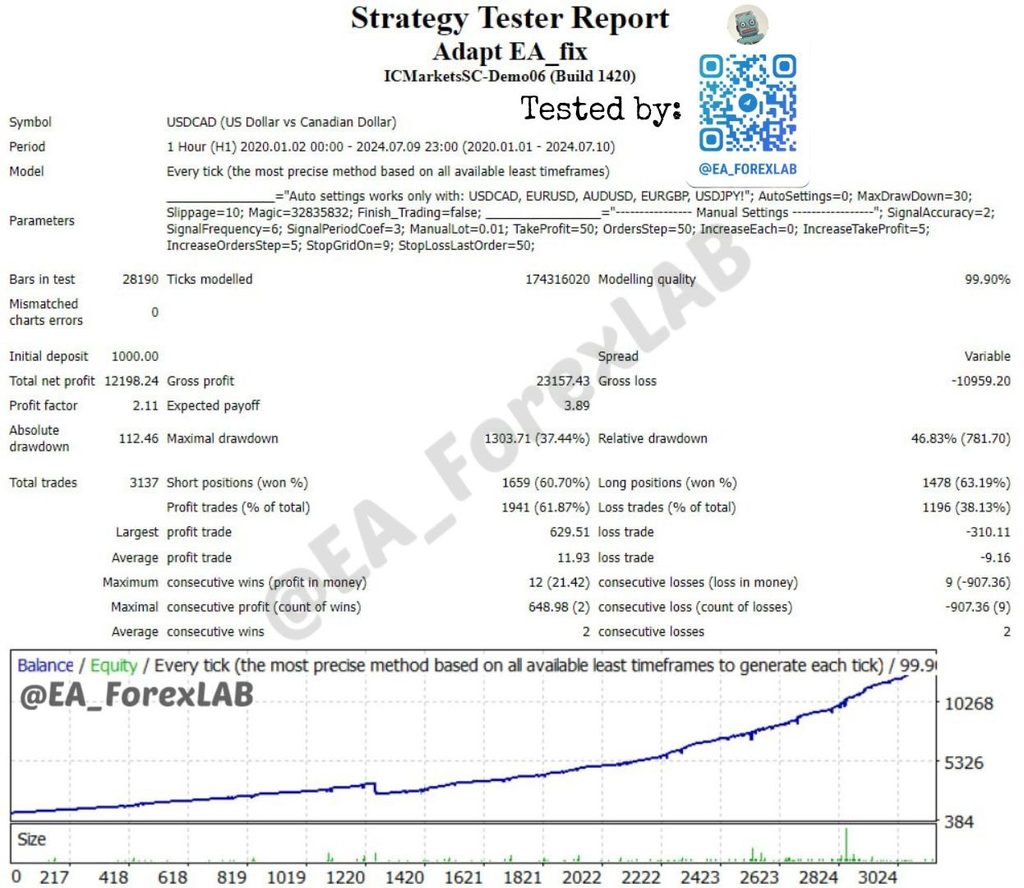
| USDCAD | 3137 | +1219.82% | 2.11 | 61.87% | 3.89 | 46.83% | +629.51 | 2.24 |
At summary level, the four reports look consistently strong: win rates clustered around 62–64%, average winners exceeded average losers on every pair, and Profit Factor stayed above 2. The drawdown and max-lot columns add the part that matters for risk: exposure did not remain close to the 0.01-lot starting size.
How Adapt EA actually trades
Following the ledgers in order, the pattern is consistent enough that we can describe a “typical” basket without hand-waving:
- An initial market order goes in at the base size, 0.01 lot.
- A same-direction limit order is queued at a worse price.
- If price moves against the position and that pending order fills, another limit is placed deeper still.
- As the basket grows, the position sizes step up rather than staying flat.
- The existing orders’ target levels get modified toward a shared basket exit area.
- A retracement can then close several positions together in one move.
- The earlier, smaller entries often close at a loss while the later, larger entries carry the basket back to positive.
The sizing progression we saw over and over looks like this:
0.01 → 0.01 → 0.02 → 0.04 → 0.08 → 0.16 → …
This isn’t an inference we drew from the shape of the equity curve. It’s visible directly in the order history: the later legs are multiples of the earlier ones, and the exit is engineered at the basket level rather than trade by trade. That single fact reframes almost every summary statistic that follows.
Does Adapt EA use martingale?
In the Adapt EA configuration we tested, the ledger shows martingale-like geometric lot escalation inside averaging baskets. A typical sequence starts 0.01 → 0.01 → 0.02 → 0.04 → 0.08, while the deepest individual positions across the four tests reached 1.36–2.56 lots. On that evidence, we would describe the tested configuration as a grid/recovery system with escalating exposure rather than a fixed-lot grid.
The terminology matters less than the mechanics. Position size increases while the strategy waits for a retracement to close the basket, so risk is path-dependent: the longer the recovery develops, the larger the later legs can become. That conclusion applies to the file we tested; we do not extend it to current Adapt EA releases without testing them separately.
“ManualLot 0.01” did not mean 0.01-lot risk
ManualLot=0.01 sets the starting size, not the ceiling. That’s the single most important thing to understand before reading any Adapt EA drawdown figure. In our ledgers the maximum individual entries were:
- EURGBP — 1.36 lots (136× the ManualLot input)
- AUDUSD — 1.60 lots (160×)
- USDCAD — 2.24 lots (224×)
- USDJPY — 2.56 lots (256×)
These are the historical maxima across the complete ledgers, not a level every basket reaches — most baskets resolve long before then. But they exist, they were filled, and they define the tail. Alongside single-trade size, the number of simultaneous same-direction positions matters just as much, because it’s the combination that drives margin and floating exposure. The exposure structure — and the fact that MaxDrawDown=30 did not act as a hard cap — is laid out in the second table.
| Pair | ManualLot input | Max single lot | Max same-direction open positions | Max observed same-direction volume | Max reconstructed holding time | Closed lot volume |
|---|---|---|---|---|---|---|
| AUDUSD | 0.01 | 1.60 | 8 | ~3.20 lots | ~21.3 days | ~125.69 lots |
| EURGBP | 0.01 | 1.36 | 6 | ~2.72 lots | ~33.6 days | ~88.31 lots |
| USDJPY | 0.01 | 2.56 | 10 | ~5.64 lots | ~18.8 days | ~135.27 lots |
| USDCAD | 0.01 | 2.24 | 10 | ~4.61 lots | ~26.9 days | ~161.67 lots |
The StopGridOn=9 input may relate to grid depth, and the maximum same-direction position counts we reconstructed (up to 10) sit close to it — but without the source code we won’t guess at its exact internal meaning. We report the observed position structure and leave the parameter’s precise semantics as an open question.
A recovery basket in real trades
A single EURGBP basket makes the sizing logic easier to see. This same-direction closure sequence shows how the later, larger legs changed the result of the earlier entries:
EURGBP — one five-position recovery closure
| 0.17 lot | −218.02 |
| 0.17 lot | −171.17 |
| 0.34 lot | −194.21 |
| 0.68 lot | +22.95 |
| 1.36 lot | +1,097.01 |
| Basket net | ≈ +536.56 |
The +1,097.01 result is EURGBP’s largest winning trade in the report. Inside the basket, however, it is the 1.36-lot recovery leg that offsets losses accumulated by the earlier, smaller entries. Looking at the trade in isolation would miss the exposure required to produce it.
USDCAD shows the same shape at a different depth. One seven-position closure ran roughly 0.06, 0.06, 0.12, 0.24, 0.48, 0.96, 1.92 lots. The early legs were underwater; the 1.92-lot leg booked +629.51 and pulled the basket back to a small positive net. When we say the risk is path-dependent, this is what we mean — the outcome depended on price coming back before the basket ran out of room, and the amount at stake by the final leg was many multiples of the first.
Pair-by-pair results
AUDUSD — the lowest reported Relative Drawdown
AUDUSD posted +1,654.76% on its 1,000 deposit across 1,785 trades, with Profit Factor 2.63 and the lowest reported Relative Drawdown of the set at 24.62%. Its maximum individual lot reached 1.60 and same-direction positions topped out at 8, making it the least extreme exposure profile of the four reports. That lower drawdown is a property of this historical sample, not a guaranteed limit built into the strategy.
EURGBP — highest Profit Factor, but 41.61% Relative Drawdown
EURGBP had the strongest Profit Factor of the group at 2.90 and the highest expected payoff (11.02 per trade), returning +1,592.78% over 1,446 trades. It also carried a reported Relative Drawdown of 41.61% and the longest single holding time we reconstructed anywhere — about 33.6 days. The highest-quality profit signature and one of the heavier drawdowns sit in the same report, which is a useful reminder that Profit Factor and drawdown answer different questions. The +1,097.01 trade from the basket above lives in this report; it is the max-lot recovery leg, not a stand-alone edge.
USDJPY — strong result, heavy profit concentration
USDJPY returned +1,583.37% over 2,397 trades at Profit Factor 2.65 and 33.30% reported Relative Drawdown. On the summary line it’s a clean result. On the balance chart there’s a large, almost vertical step late in the test, and the ledger explains it. On 18 December 2023 a same-direction seven-trade basket — sized roughly 0.04, 0.04, 0.08, 0.16, 0.32, 0.64, 1.28 lots — closed together for about +6,574.72. The 1.28-lot leg alone made +3,544.47, which is roughly 22.4% of the entire USDJPY test’s final net profit from a single trade. The whole seven-trade closure is about 41.5% of the final result, and the ten largest winners together account for roughly 59% of it.
That concentration isn’t automatically a flaw — a profitable system is allowed to have big winners. But it changes how much weight the Profit Factor deserves. When a meaningful share of the endpoint comes from a handful of deep recovery events, the smooth-looking equity curve is hiding a lumpy distribution underneath, and the reader should be able to see that before drawing conclusions.
USDCAD — largest sample, highest reported Relative Drawdown
USDCAD is the biggest sample at 3,137 trades and the highest reported Relative Drawdown at 46.83%, returning +1,219.82% at Profit Factor 2.11 — the lowest PF of the four, though still comfortably above 2. Its maximum individual lot reached 2.24 and same-direction positions reached 10. It also gave us the clearest look at how holding time relates to outcome, which is worth its own section.
When a grid basket lasts too long
For a strategy that averages into a move and waits for a retracement, time in market is a rough proxy for stress: the longer a basket stays open, the further price has usually travelled against it. USDCAD lets us see that directly. Splitting the ledger by holding time, trades that closed within 24 hours produced roughly +14,764.85, while trades that stayed open longer than a day produced roughly −2,565.91. The test’s profit was made by the shorter-duration trades; the longer-lived positions were a net drag on it.
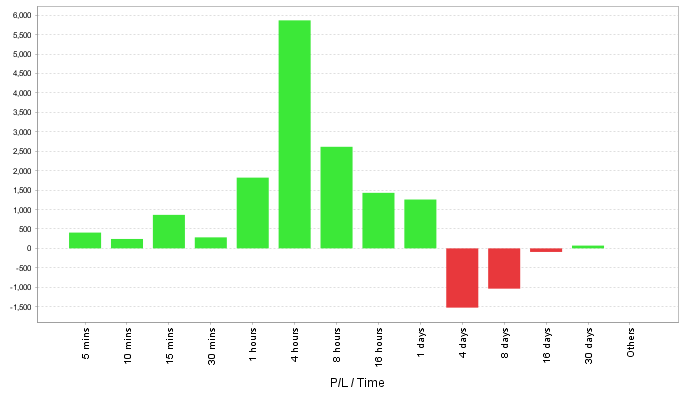
This wasn’t unique to USDCAD. Reconstructing the same split on the other pairs, trades held longer than eight days came out net negative on all four: about −275 on USDJPY, −1,790 on AUDUSD, −1,475 on EURGBP, and roughly flat-to-slightly-negative on USDCAD. Consistent across four different markets, that points at the same thing the basket examples showed — the prolonged recovery episodes are the stress tail of the system, and they’re where the economics deteriorated.
This is a description of the tested ledgers, not a rule to close every basket after eight days. What it does show is that prolonged recovery episodes were the weakest part of the historical P/L distribution and should be treated as part of the strategy’s risk profile.
When it traded, and which direction
Adapt EA traded throughout the server day in our sample, but the activity wasn’t evenly spread — it thinned out in the Asian hours and concentrated later, roughly around the European/US overlap in the mid-to-late afternoon server time.
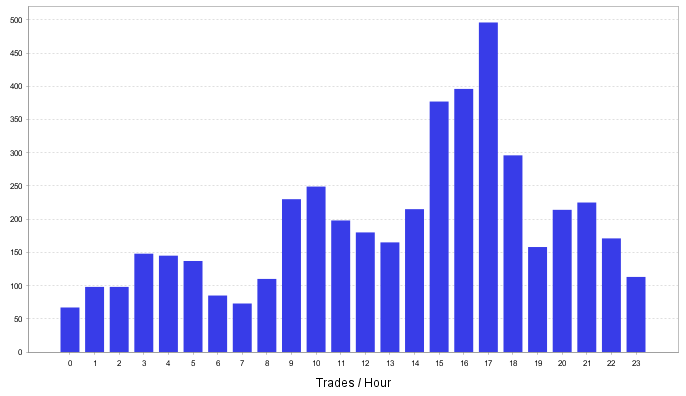
We’re showing this as distribution, not as a recommendation. There’s a strong temptation with charts like this to declare a “best hour” or to bolt on a session filter, but nothing here was tested out of sample, and curve-fitting an entry window to a single historical run is exactly the mistake our backtests-versus-live analysis warns about.
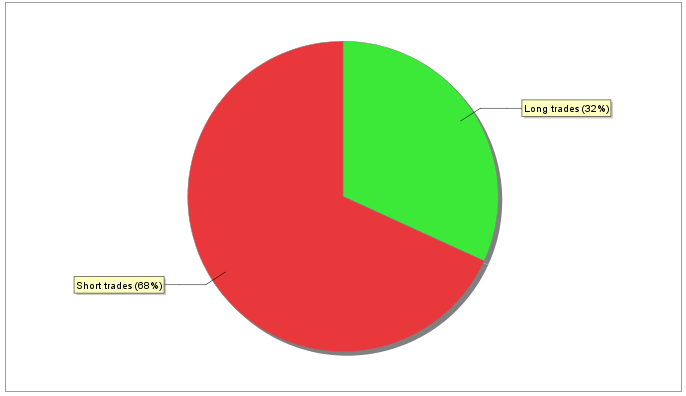
On direction, we use the exact position counts from the MT4 reports rather than a summary chart. Across the four, both sides contributed materially — this isn’t a long-only or short-only system. The most lopsided case was USDJPY, where longs won 68.64% against 56.76% for shorts; on the other three pairs the two sides sat within a few points of each other. Because so much of the USDJPY result came from a few deep recovery closures, we’d caution against reading its directional win-rate gap as a clean edge.
Trading costs and Forex rebates: what 510.94 lots of turnover means
A grid/recovery architecture turns one directional idea into many transactions, and that has a cost consequence worth quantifying. Adding up closed volume across the four separate reports — USDCAD ~161.67 lots, USDJPY ~135.27, AUDUSD ~125.69, EURGBP ~88.31 — gives roughly 510.94 lots of closed turnover. That’s a volume statistic across four independent tests, not one account, and it’s the number that makes cost control genuinely relevant here rather than an afterthought.
Why turnover matters for this specific design:
- Spread is paid on every leg, and baskets have many legs.
- Commission, where a broker charges it, scales with lot size — and the later legs are the large ones.
- Slippage bites hardest on the biggest, latest entries, which is precisely where this strategy is largest. Our tests did not model it.
- Multi-day and multi-week holds introduce swap/rollover exposure that a short-hold scalper never touches.
Two honest limits on the cost side: commission treatment isn’t separately established from these standard MT4 exports, so we haven’t invented a historical commission figure, and — as noted earlier — the Slippage=10 input is not evidence that adverse fills were simulated. What we can say is that for a system generating this much volume, the deterministic slice of trading cost is large enough to be worth managing on its own terms.
This is where rebates become economically relevant without changing our assessment of the strategy. Our operating principle is simple: profit is probabilistic; trading costs are deterministic. A rebate returns part of eligible spread or commission costs based on confirmed trading volume, regardless of whether an individual trade wins or loses. For a high-turnover grid EA, reducing that cost drag matters. It does not shrink the grid, cap lot escalation, shorten a prolonged basket, remove slippage, change swap, or make a high-risk configuration safer.
For context, our ForexLAB Rebate service currently lists maximum potential rates of up to $1.60/lot on IC Markets, up to $2.00/lot on Tickmill and up to $2.50/lot on RoboForex. These are maximum rates, not guaranteed accruals; actual rebate depends on broker eligibility, account type, instrument and trading conditions, and the published rates can change.
If you already trade EAs on a supported broker, the sensible move is to check the current ForexLAB Rebate rate for your account type before estimating any cost benefit — and to keep that estimate mentally separate from the question of whether the strategy itself is one you want to run.
Are these backtests robust?
The historical evidence is strong in several respects, but it does not answer every question that matters before live use.
What the tests do show. Four profitable runs on four currency pairs, 8,765 trades, Profit Factor 2.11–2.90, win rates around 62–64%, average winners larger than average losers on every pair, 99.90% modelling quality and real spread. That is meaningful positive historical evidence.
What the tests don’t establish. We have no independent forward record matching these exact reports, no out-of-sample or walk-forward run, and no parameter-sensitivity study showing how the result changes when inputs move away from this configuration. Slippage was not modeled and commission treatment is not independently established. Current releases may also differ from the Adapt EA file tested here. For those reasons, we treat these results as a strong starting point for further validation rather than a finished verdict. Our forward-testing methodology explains what we would want to see next.
Who might this risk profile suit?
The tested profile is most relevant to traders who already understand grid/recovery mechanics and evaluate the exposure structure, not only the final backtest curve.
It could be relevant to a trader who understands grid/recovery mechanics going in, is comfortable with multiple simultaneous same-direction positions and multi-week holds, intends to forward-test on a demo or micro account first, and actively watches margin, lot escalation and broker costs. That’s a specific, informed profile — not a beginner default.
It’s a poor fit for anyone who wants fixed-lot, bounded risk; anyone reading MaxDrawDown=30 as a hard 30% ceiling; anyone assuming ManualLot=0.01 means their largest position will be 0.01; or anyone who can’t tolerate a basket sitting open, and growing, for weeks. If any of those describe you, the mismatch isn’t a detail — it’s the whole story.
Our read on the evidence
The four reports show a strong historical result: every pair finished profitable, the sample is large, and the per-trade payoff statistics are favourable. The same reports also show a path-dependent grid/recovery structure with geometric lot escalation, multi-position baskets, individual entries reaching 1.36–2.56 lots, reported Relative Drawdown up to 46.83%, and material profit concentration in a small number of deep recovery closures — most visibly on USDJPY. That risk profile is much more aggressive than the older conservative description suggested.
Our read is straightforward: the tested configuration behaves like a high-risk recovery system with strong historical backtest results, not a low-risk fixed-exposure EA. Before we would consider a configuration like this for live use, we would want forward testing on the exact current build, a proper margin and worst-case-basket analysis, and transaction-cost modeling that includes realistic slippage and swap. The backtests show the upside clearly; the ledgers show the exposure required to achieve it.
Educational research only — not financial advice, and not a signal to trade. Backtest results do not guarantee future performance. See our Forex EA Database for how this EA sits alongside others we’ve tested.
Download the EA files and view the original test materials in our Telegram channel:
