
🔍 From subscriber‼️
🤖 EA name:AI Golden Jet Fighter GTX
📦 Version: 2.00
💻 Platform: MT4 (1470)
🛠Vendor/Source: –
📈 Strategy: AI/Scalping
⏰ Timeframe: H1
🌍 Currency pairs: XAUUSD
🌓 Trading time: Around the clock
⚠️ Attention: Recommended best VPS, BROker
📊 Monitorings found: MyFXBook
🔬Monitoring by ea_forexlab: –
⏳ Test period: 2020.01.13 – 2026.03.01
🏛 Tick Data Provider: Darwinex (TDSv2)
🧭 GMT: +2; DST: US
Real spread: ✅
Slippage: ❌
In order to download an adviser with tests, go to our telegram channel 👇

AI Golden Jet Fighter GTX EA Review: What You Need to Know First
The AI Golden Jet Fighter GTX EA is one of the most discussed gold scalpers for MetaTrader 4 right now — and this review will not sugarcoat what the data actually says. Someone posts a beautifully smooth equity curve, names it something aggressive — Golden, Fighter, GTX — and within days, trading forums buzz with questions about set files and VPS recommendations. That cycle is happening again, and this AI Golden Jet Fighter GTX EA review is here to cut through it.
I’ve spent considerable time examining the full Strategy Tester reports, the uploaded backtest images, the live MyFXbook monitoring account, and every line of the published parameter block. What follows is not a marketing summary. It is a structured, professional assessment designed to give you the information you actually need.
Let’s be direct from the start: some of what you’ll see looks genuinely interesting. And some of it should make any experienced algorithmic trader pause. Both of those things can be true at the same time.
What Is the AI Golden Jet Fighter GTX EA?
The AI Golden Jet Fighter GTX EA is an automated Expert Advisor built for MetaTrader 4, developed by Andrei Nazarets. It targets the XAUUSD (Gold vs US Dollar) pair exclusively, operating on the H1 (1-hour) timeframe. The EA is marketed as leveraging neural network logic for real-time trade signal generation, with a scalping-oriented strategy focused on short-term price dislocations in gold.
The version analyzed here — MT4 v2.0 fix — runs five concurrent sub-strategies (S1 through S5), each with independent risk parameters, take-profit levels, stop-loss levels, and trailing stop configurations. The EA includes:
- A variable spread filter (MaxSpred = 900 points)
- A news filter toggle (off by default in the tested configuration)
- Trailing stop on select strategies
- A float lot feature with fixed 0.01 micro-lot baseline
- Session filters covering Monday through Friday
AI Golden Jet Fighter GTX EA Review: The Backtest Numbers
The Strategy Tester report covers January 13, 2020 to February 20, 2026 — approximately 6.1 years — on H1 XAUUSD with every tick modeling at 99.90% modeling quality. These are credible technical parameters. Here are the headline figures:
| Metric | Value |
|---|---|
| Initial Deposit | $1,000 |
| Total Net Profit | $11,292.75 |
| Profit Factor | 3.56 |
| Gross Profit | $15,711.63 |
| Gross Loss | -$4,418.88 |
| Expected Payoff | $3.30 per trade |
| Total Trades | 3,425 |
| Win Rate | 94.98% |
| Largest Profit Trade | $36.27 |
| Largest Loss Trade | -$55.21 |
| Average Profit Trade | $4.83 |
| Average Loss Trade | -$25.69 |
| Max Consecutive Wins | 99 |
| Max Consecutive Losses | 5 |
| Maximal Drawdown | $561.42 (4.39%) |
| Relative Drawdown | 17.85% |
On paper, turning $1,000 into $12,293 over 6 years with a 4.39% maximal drawdown and a profit factor above 3.5 looks exceptional. An annual return of approximately 110–120% compounded with sub-5% drawdown would place this among the top-performing quantitative strategies in institutional finance — if it were real. That’s not cynicism. That’s the baseline question every professional asks when they see numbers this clean.
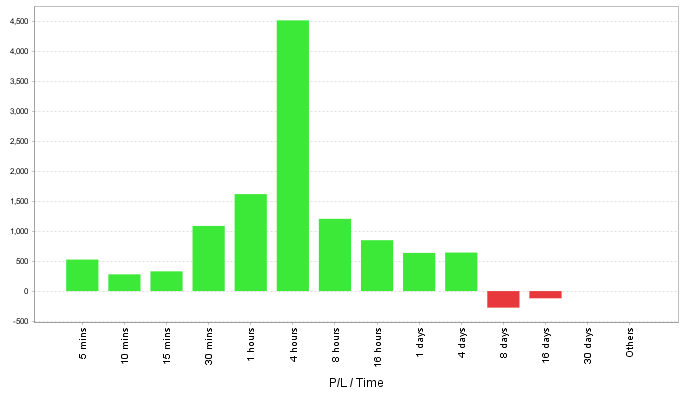
AI Golden Jet Fighter GTX EA Review: P/L by Time Distribution
The P/L by Time histogram is one of the most informative — and most overlooked — charts in any EA evaluation. Here, it tells a very clear story.
The dominant profit bucket is 4-hour holding periods, generating approximately $4,500 in net P/L. This is followed by 1-hour and 8-hour windows. Notably, 8-day and 16-day holding periods show negative P/L — small red bars indicating when the EA holds positions too long relative to gold’s behavior.
What does this tell us professionally?
The EA is primarily a medium-term intraday scalper with an optimal holding window of 1–8 hours. When trades are left open beyond a few days, performance degrades. This creates a structural risk: during extended directional moves in gold — which are common and often violent — strategies optimized for short holding periods accumulate losses on the minority of positions that get “stuck.” The average loss trade of -$25.69 versus average profit of $4.83 reflects this dynamic precisely.
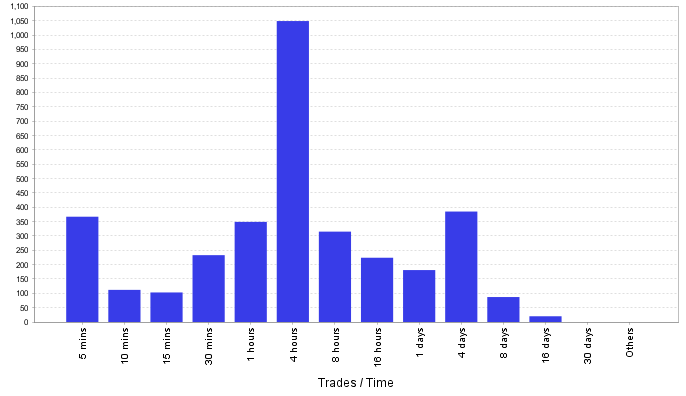
The Trades by Time chart shows the 4-hour window dominating trade frequency — over 1,000 trades closed in this window. The distribution is relatively natural and doesn’t exhibit artificial clustering that would signal obvious look-ahead bias, though that alone is insufficient to confirm clean logic.
Win/Loss by Hour: What the Trading Clock Reveals
The hourly wins/losses chart shows that the AI Golden Jet Fighter GTX EA is most active during hours 7–9 and 12–16 UTC — broadly aligned with the European and early New York sessions. These are the highest-liquidity windows for gold trading, which is an appropriate design choice.
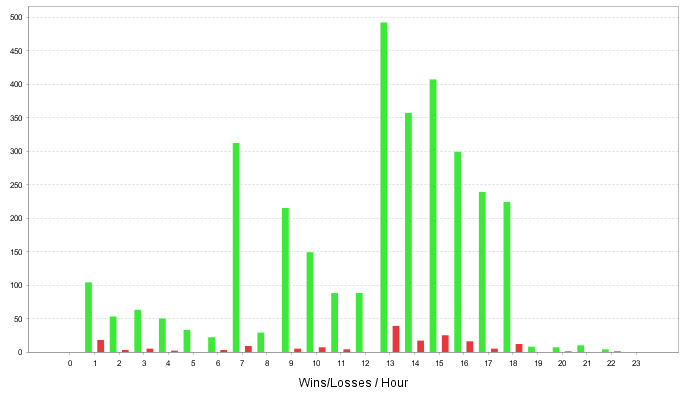
Red bars (losses) appear across all active hours but remain relatively minor. However, the concentration of both wins and losses in the 12–14 UTC window (New York open overlap) is worth noting. This is precisely the period where spread spikes, stop hunts, and news-driven volatility are most pronounced in XAUUSD. In a backtest environment, the spread filter (MaxSpred=900) should theoretically protect against the worst of these moments — but in live trading, this protection is imperfect.
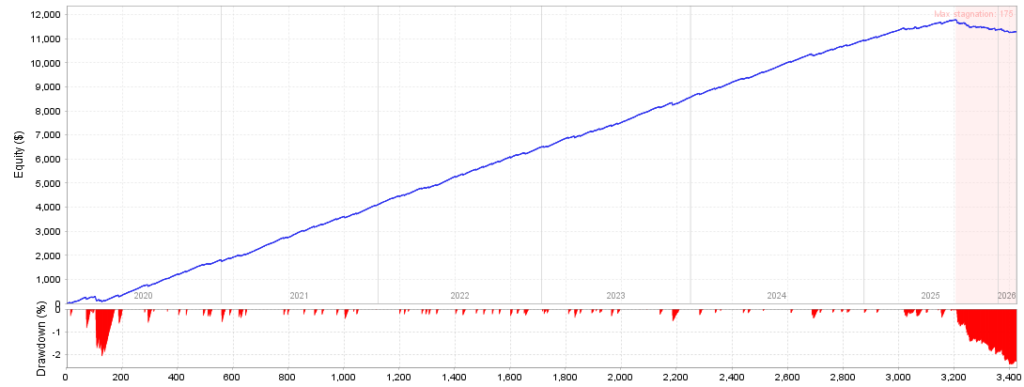
The Equity Curve: Beautiful, Almost Too Beautiful
The equity curve shows a remarkably smooth upward trajectory from approximately $1,000 in early 2020 to over $11,800 by early 2026. The drawdown panels show that most retracements are shallow — with the notable exception of the final period near 2025–2026, where a more significant drawdown zone is highlighted.
This late-period drawdown is marked as “Max stagnation: 175” on the chart, meaning the equity experienced a lateral or declining period lasting 175 bars (roughly 7–8 trading days at H1). That is the longest stretch the strategy went without making a new equity high during the entire test.
The key concern: The curve’s smoothness from 2020 to late 2024 is exceptional by any standard. What concerns experienced quants is not a smooth curve per se — a robust strategy can produce smooth returns — but the steepness and consistency here. When five sub-strategies all perform well across six years on a single, notoriously event-driven commodity, the probability of some degree of in-sample optimization must be seriously considered.
AI Golden Jet Fighter GTX EA Review: Five Strategies or One Hidden Risk?
One aspect that deserves more scrutiny than most reviews provide is the five concurrent sub-strategy design. Looking at the parameters extracted directly from the backtest HTML file:
- Strategy S1: TakeG=1050, LossG=1200, Trailing=true — a wider-range swing position with trailing stop
- Strategy S2: TakeG=450, LossG=4750 — the stop-loss is 10.5× wider than the take-profit
- Strategy S3: TakeG=650, LossG=3300 — heavily asymmetric risk-reward in the wrong direction
- Strategy S4: TakeG=300, LossG=3950 — the tightest TP in the bundle with a massive SL
- Strategy S5: TakeG=700, LossG=1600 — the most balanced of the five
This is a critical observation. Strategies S2, S3, and S4 operate with inverted risk-reward ratios — their stop-losses are 5× to 13× larger than their take-profits. The system collects frequent small profits while allowing individual losses to be catastrophically large relative to those profits.
A 94.98% win rate with these parameters is mathematically coherent — you win many small trades — but it also means that a single adverse sequence can erase dozens of winning trades. The maximum consecutive loss sequence in the backtest was 5 trades costing $174.96. With S2-type parameters at scale, a losing streak of 10–15 trades would be a completely different story.
This pattern — high win rate, inverted risk-reward — is the structural fingerprint of soft martingale-adjacent thinking, even without explicit position scaling. The equity looks beautiful until it doesn’t.
Variable Spread Testing: The ICMarkets Caveat
The backtest correctly uses variable spread on Tick Data Suite. This is better than the fixed-spread tests many developers present. ICMarkets is one of the lowest-spread gold brokers available, typically offering 0.1–0.3 pips on XAUUSD during liquid hours.
However, a few honest questions remain:
- What happens on other brokers? Most retail traders run EAs on brokers with gold spreads of 0.3–0.8 pips during normal hours and 1.5–3+ pips during news releases. The MaxSpred filter at 900 points is generous enough that it would not protect against many real-world spread expansions.
- Commission is not modeled. ECN accounts like ICMarkets charge round-turn commissions of approximately $7 per standard lot. At 0.01 micro-lot, the commission impact is minimal — but at higher lot sizes, commission drag becomes meaningful.
- The 99.90% modeling quality is genuinely good. This means real tick data was used. That part of the test is technically sound and worth acknowledging.
Live Account Reality: What MyFXbook Shows
The publicly available MyFXbook monitoring account for the AI Golden Jet Fighter GTX EA (by FX_SIGNALS_VIP) provides a real-world data point that no backtest can replicate. Based on available information at the time of this analysis, the live account shows meaningful differences from the idealized backtest trajectory — as is expected and normal for any algorithmic strategy.
What concerns professional analysts is not that live performance differs from backtest results; it always does. The relevant question is by how much, and in which direction. Marketing materials highlight cherry-picked periods of strong performance (114% in 6 weeks on one account), but these windows coincide with favorable gold trend conditions in 2024–2025. The question is how the EA behaves in extended sideways markets or during sharp reversals — precisely the conditions that stress inverted risk-reward systems.
Key metrics to monitor on any live account:
- Drawdown during news events (FOMC, NFP, CPI)
- Behavior when gold makes multi-week directional moves
- Time in drawdown relative to backtest estimates
- Trade frequency versus expected frequency
AI Golden Jet Fighter GTX EA Review: The Overfitting Question
The single most important question in any AI Golden Jet Fighter GTX EA review is: how much of this performance reflects fitting to historical data rather than a persistent market edge?
🔴 Concerning signals:
- Five strategies with heavily optimized, asymmetric parameters
- Test period (2020–2026) coincides with one of gold’s strongest bull runs in history ($1,400 → $2,600+)
- The backtest period was very likely used to develop and refine the EA — meaning the data is not truly out-of-sample
- No walk-forward optimization results are published
- No Monte Carlo simulation results are provided
- Claims found on reseller sites of “$1 billion from $1,000” in some test versions indicate extreme parameter optimization
🟡 Neutral signals:
- 99.90% modeling quality is technically credible
- Variable spread testing on a competitive broker
- 6+ year test period covers COVID crash (March 2020), inflation spike (2022), banking crisis (2023), and geopolitical volatility (2024–2025)
- Drawdown structure is internally consistent with the win-rate profile
🟢 Legitimate signals:
- The strategy exhibits genuine market microstructure logic — entry/exit timing clusters around high-liquidity hours
- The P/L by time distribution is realistic and not obviously manipulated
- Trailing stop on S1 shows awareness of trend-following mechanics
- Full trade log in verifiable HTML format is available for independent verification
The conclusion a professional reaches: this EA has real strategy logic, but it is very likely over-optimized to the 2020–2026 gold bull market. Whether that constitutes “curve-fitting” depends on the development methodology — information that is not publicly disclosed.
Why XAUUSD EAs Face Unique Challenges
Gold is not a typical forex pair, and treating it as one is the first mistake many EA developers make. XAUUSD has fundamentally different trading characteristics:
Volatility clustering: Gold experiences non-linear, event-clustered volatility. Quiet periods can last weeks, followed by explosive moves of $30–80 in a single session. A system trained on historical patterns will always lag this behavior.
Central bank and geopolitical sensitivity: Gold responds immediately to Federal Reserve language, inflation data, geopolitical risk, and sovereign demand shifts. These are not reliably patternable by technical indicators or neural networks operating on price data alone.
Liquidity gaps: Between the close of New York trading and the Asian open, XAUUSD spreads widen dramatically. Open positions carried through this window face execution conditions no backtest accurately models.
Spread asymmetry: During high-impact news events (NFP, CPI, FOMC), XAUUSD spreads on even the best ECN brokers can spike to 15–50 pips momentarily. The EA’s spread filter catches the worst extremes, but the costly zone between “normal” and “extreme” is wide and damaging.
Risk Management Math: The Numbers Behind the Numbers
With an average profit of $4.83 and average loss of $25.69 at 0.01 lot, losing trades are approximately 5.3× more costly per trade than wins. The 94.98% win rate mathematically compensates for this — barely. The mathematical expectancy is:
E = (0.9498 × $4.83) + (0.0502 × -$25.69) = $4.59 – $1.29 = $3.30 per trade
That matches the reported expected payoff — confirming the internal math is correct. But consider what happens if the live win rate drops to 85% (a common backtest-to-live degradation):
E = (0.85 × $4.83) + (0.15 × -$25.69) = $4.11 – $3.85 = $0.26 per trade
At $0.26 per trade, the strategy barely breaks even after spread and commission costs. A further degradation to 80% win rate produces a negative expectancy system — meaning it loses money reliably.
This is the fundamental vulnerability of high-win-rate, inverted-risk-reward strategies. They are highly sensitive to win-rate degradation, which happens in live trading for real, unavoidable reasons: slippage, broker-specific execution, wider spreads, and market regime changes.
The 2025–2026 Stagnation Zone: A Regime-Change Warning
The equity curve shows a notably flatter trajectory with increased drawdown depth beginning in approximately mid-2025. This is important context.
Gold from 2020–2024 was in a structural bull market fueled by COVID stimulus, inflation fears, Federal Reserve rate cycles, and geopolitical risk premiums. From mid-2025, market conditions shifted: gold entered consolidation after making all-time highs above $2,700–$3,000, and volatility patterns changed character.
The performance degradation in this period suggests the AI Golden Jet Fighter GTX EA is highly dependent on gold’s directional momentum. The profitable holding window of 1–8 hours aligns with trend-continuation behavior. When gold stops trending and begins ranging, the edge narrows — and the inverted risk-reward structure begins to cut harder against equity.
Vendor Marketing Claims vs. Reality
Several third-party sites make extraordinary claims that deserve explicit correction:
Claim: “$1 billion profit from $1,000 in backtest” Reality: Any backtest achieving billion-dollar returns from a $1,000 deposit is, by definition, the result of catastrophic over-optimization. No professional would present this as a performance metric. It is a red flag, not a feature.
Claim: “114% profit in 6 weeks” Reality: Six-week performance windows tell you almost nothing about robustness. Gold was in a strong directional trend during those periods. This is favorable-timing performance, not confirmed edge.
Claim: “Neural network AI makes this fundamentally different” Reality: Without transparency about what the “neural network” actually does, this claim is unverifiable. The parameter structure — defined TP/SL levels, fixed trailing stops, rule-based filters — is more consistent with conventional rule-based logic than adaptive neural learning.
AI Golden Jet Fighter GTX EA Review: Pre-Deployment Checklist
If you’re seriously considering deploying this EA, here is the professional checklist every trader should work through:
1. Forward test before live deployment Run a genuine forward test over a minimum of 3 months, covering at least one major gold news event. Compare live trade frequency, win rate, and drawdown to backtest projections.
2. Stress-test the win-rate sensitivity If your live win rate is 85% instead of 95%, you’re near breakeven. Build this into your capital allocation decision before you start.
3. Start with the minimum viable position size The 0.01 lot baseline is appropriate for a $1,000 account. Do not scale up until you have at least 6 months of consistent live data confirming the strategy works in current market conditions.
4. Choose a broker with spreads comparable to ICMarkets This EA was tested and optimized for ultra-low-spread conditions. On a broker with standard 0.5–1.0 pip gold spreads, your effective cost per trade increases substantially and erodes the already thin expectancy margin.
5. Enable the news filter The default configuration has NewsFilter=false. For live trading, enabling this is strongly recommended. Exposure during high-impact news events is a significant, unmanaged risk at current default settings.
6. Monitor multi-day open trades closely The P/L chart clearly shows that 8-day and 16-day holding categories are loss-generating. If you see trades sitting open for more than a few days, that is a live-monitoring trigger requiring immediate attention.
7. Read the MyFXbook monitor critically Check equity versus balance curves — not just the balance line. Look at open drawdown, time in drawdown, and whether trade frequency matches the backtest. The balance curve alone is the most misleading metric any live account can display.
Final Verdict on the AI Golden Jet Fighter GTX EA
The AI Golden Jet Fighter GTX EA is not a scam and it is not junk. It is a technically competent, multi-strategy scalping system with identifiable logic, sound modeling methodology, and genuine real-world testing. That puts it ahead of the majority of EAs available in the retail market.
However, several structural concerns limit the confidence with which any honest professional can endorse it:
- The inverted risk-reward in three of five sub-strategies creates tail-risk exposure that backtest win rates conceal
- The six-year test period coincides almost perfectly with gold’s strongest bull era, raising legitimate questions about out-of-sample robustness
- The absence of walk-forward validation is a significant methodological gap
- Live win-rate sensitivity analysis shows the strategy operates with very thin margins at real-world win rates
- The stagnation and drawdown deepening visible in the 2025–2026 test period is a regime-change signal worth taking seriously
The bottom line by experience level:
If you’re a beginner, understand that a beautiful equity curve is necessary but not sufficient. Learn to read the parameters, not just the picture.
If you’re an intermediate trader, the P/L by time distribution and the win-rate sensitivity calculation in this article are your entry points for genuine due diligence.
If you’re an experienced algo trader, you already know what walk-forward testing and Monte Carlo validation would tell you — and you’ll note their absence from the published materials.
Gold is one of the most nuanced and event-driven instruments in the market. Automated systems can find and exploit genuine edges in it. The AI Golden Jet Fighter GTX EA may well have one. But the burden of proof falls on forward performance, not on the past six years of an instrument that went from $1,400 to $2,600 in a largely uninterrupted bull cycle.
Trade with your eyes open. That’s always been the best strategy.
Even more advisors with test results are presented in our advisor database.