

🔍 From subscriber‼️
🤖 EA name: Gold Zilla AI
📦 Version: 1.1
💻 Platform: MT4 (1470)
🛠Vendor/Source: –
📈 Strategy: AI/Scalping
⏰ Timeframe: m1
🌍 Currency pairs: XAUUSD
🌓 Trading time: Around the clock
⚠️ Attention: Recommended best VPS, BROker
⏳ Test period: 2020.01.01 – 2026.04.19
🏛 Tick Data Provider: Darwinex (TDSv2)
🧭 GMT: +2; DST: US
Real spread: ✅
Slippage: ❌
📌 All EAs tests EA ForexLab
In order to download an adviser with tests, go to our telegram channel 👇

Gold Zilla AI EA Review: What the Marketing Doesn’t Say
Every few months, a new gold Expert Advisor appears with a compelling name, a smooth equity curve, and a pitch built around “AI” and “multi-strategy.” Gold Zilla AI for MetaTrader 4 is the latest addition to this category — and this Gold Zilla AI EA review will do what vendor pages never do: go through the raw backtest data trade by trade and tell you exactly what is happening beneath the surface.
The findings are significant. What is marketed as a “multi-strategy AI algorithm” contains a pattern of behavior that professional algorithmic traders will immediately recognize as one of the most dangerous structures in retail EA design: simultaneous uncapped open positions with no stop-losses, held for weeks against a trending market.
Let’s go through the complete picture methodically — the numbers, the logic, and the critical questions every trader should ask before risking real capital on this system.
What Is the Gold Zilla AI EA?
The Gold Zilla AI EA (v1.1) is an automated Expert Advisor for MetaTrader 4, developed by Christophe Pa Trouillas and marketed under the “MetaSignalsPro” profile on MQL5.com. It trades exclusively on XAUUSD (Gold vs US Dollar) on the M1 (1-minute) timeframe, and is described as a “multi-strategy algorithm detecting market regimes to dynamically select from five distinct strategies, optimizing returns while minimizing drawdown on XAUUSD.”
The EA operates with an AI API key connection (requiring external server communication post-purchase), a compound growth effect, and up to five concurrent trading strategies. In the version analyzed here, only Strategies 1 and 2 are active — Strategies 3, 4, and 5 are disabled.
The price point is $149 for the MT5 version and an equivalent for MT4, with a “live signal” reference on MQL5. The backtest examined in this analysis was conducted via Tick Data Suite (TDS) using real tick data from Darwinex broker, executed through the ICMarkets terminal with a modeling quality of 99.90% — one of the most rigorous testing methodologies available for MT4 EA validation.
First Red Flag: The Live Signal Is Disabled
Before analyzing a single line of backtest data, the most important piece of due diligence for any Gold Zilla AI EA review is checking the live monitoring account. The MQL5 signal referenced in the product listing (signal ID 2116681) returns a single, definitive message:
“Unfortunately, the Opal signal is disabled and unavailable. Provider has disabled this signal.”
The signal account is gone. It does not redirect to a successor account with a clean track record. It simply does not exist anymore.
In the retail EA market, a disabled signal is one of the most informative data points available. Developers disable signal accounts for a small number of reasons: account blown, drawdown too severe to display publicly, or account restructured after losses. Healthy, profitable signals are not disabled. They are promoted.
The original signal was labeled “Opal” — not even “Gold Zilla” — which suggests it may have been a personal trading account repurposed as a product signal. Whatever the reason for the shutdown, the practical consequence for any prospective buyer is the same: there is no verifiable live performance history for this EA. The only data available is the vendor-provided backtest.
The Backtest Setup: Genuinely Strong Methodology
In contrast to the live monitoring situation, the backtest methodology deserves genuine credit. The test runs:
- Period: January 2, 2020 — April 17, 2026 (approximately 6.4 years)
- Symbol: XAUUSD, M1 timeframe
- Model: Every tick, 99.90% modeling quality
- Tick data source: Darwinex broker (third-party, not the developer’s own broker)
- Execution terminal: ICMarkets (tight-spread ECN environment)
- Spread: Variable
- Slippage: 0.5 (slp1 parameter)
Using Tick Data Suite with third-party Darwinex tick history is a significantly more robust testing environment than standard MT4 backtesting. Darwinex is a regulated broker with high-quality tick data, and the combination of ICMarkets execution modeling with variable spread represents close to best-practice conditions for M1 gold backtesting.
This methodological rigor is important because it means the results — both positive and negative — are more trustworthy than the average EA backtest. When something looks wrong in this data, it is genuinely wrong.
Gold Zilla AI EA Review: The Headline Statistics
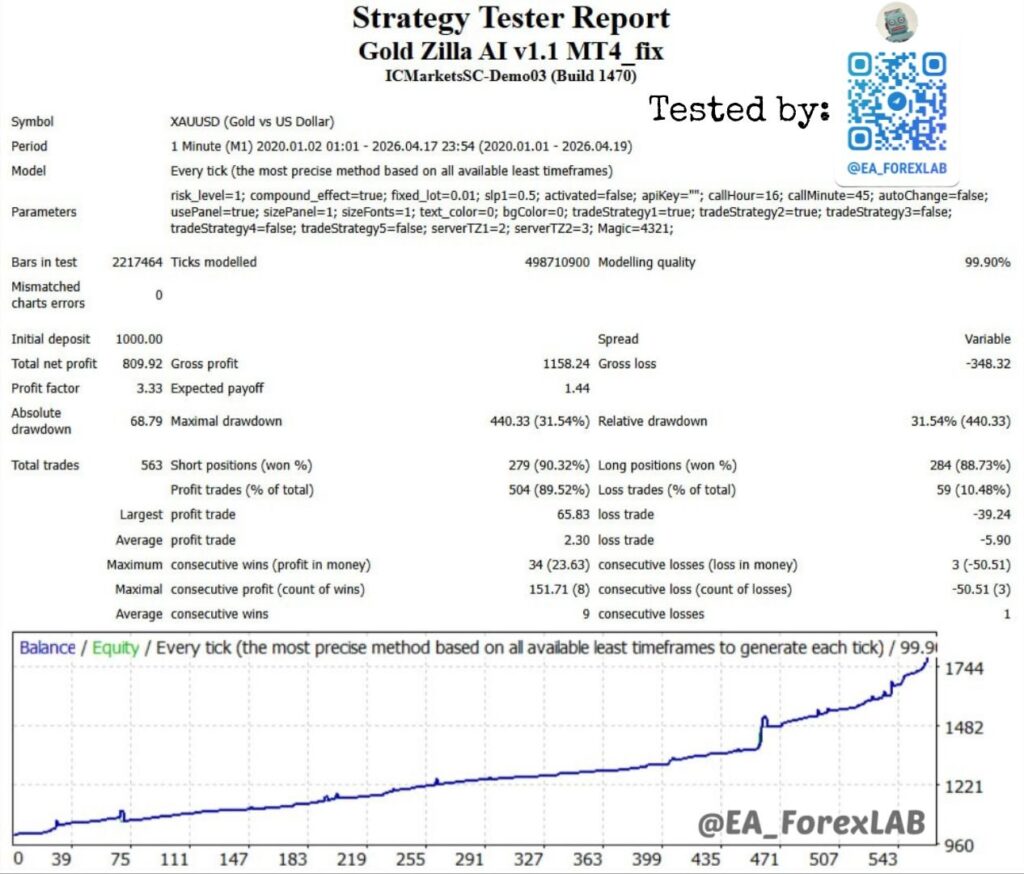
The Strategy Tester report shows:
| Metric | Value |
|---|---|
| Initial Deposit | $1,000 |
| Total Net Profit | $809.92 |
| Gross Profit | $1,158.24 |
| Gross Loss | $348.32 |
| Profit Factor | 3.33 |
| Expected Payoff | $1.44 per trade |
| Total Trades | 563 |
| Win Rate | 89.52% (504/563) |
| Short Won % | 90.32% |
| Long Won % | 88.73% |
| Largest Profit Trade | $65.83 |
| Largest Loss Trade | $39.24 |
| Average Profit Trade | $2.30 |
| Average Loss Trade | $5.90 |
| Max Consecutive Wins | 34 |
| Max Consecutive Losses | 3 |
| Maximal Drawdown | $440.33 (31.54%) |
| Absolute Drawdown | $68.79 |
The profit factor of 3.33 and 89.52% win rate look solid at first glance. The expected payoff of $1.44 per trade is modest but positive. An 80% growth over 6.4 years from $1,000 to $1,810 seems reasonable.
Then you see it: 31.54% maximal drawdown on a $1,000 account.
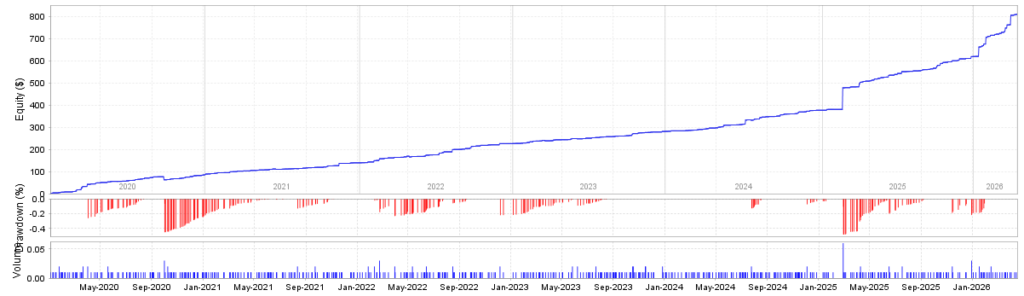
A 31.54% drawdown is not a minor statistic to footnote. It means that at some point during this backtest, a trader who started with $1,000 was watching a theoretical $440 evaporate — nearly half their starting capital — in unrealized losses. The absolute drawdown of $68.79 (balance-based) versus the $440.33 equity drawdown (open position-based) tells you precisely what happened: the system held multiple losing positions open simultaneously for an extended period. The balance barely moved, but the equity was devastated.
The critical question is when, how, and why this happened.
Gold Zilla AI EA Review: The February 2025 Disaster Decoded
By parsing every trade in the HTML backtest report individually, it becomes possible to reconstruct exactly what caused that 31.54% equity drawdown. The answer is a single 23-day event in February 2025 that reveals the true operating logic of this EA.
Here is what happened, trade by trade:
| Order | Direction | Open Date | Open Price | Close Date | Close Price | P/L |
|---|---|---|---|---|---|---|
| 457 | SELL | Feb 4, 2025 | $2,818.84 | Feb 27, 2025 | $2,872.34 | -$39.24 |
| 458 | SELL | Feb 5, 2025 | $2,847.41 | Feb 27, 2025 | $2,872.34 | -$11.25 |
| 459 | SELL | Feb 7, 2025 | $2,869.72 | Feb 27, 2025 | $2,872.34 | +$8.77 |
| 460 | SELL | Feb 10, 2025 | $2,907.23 | Feb 27, 2025 | $2,872.34 | +$45.71 |
| 461 | SELL | Feb 14, 2025 | $2,930.79 | Feb 27, 2025 | $2,872.34 | +$65.83 |
| 462 | SELL | Feb 17, 2025 | $2,893.35 | Feb 27, 2025 | $2,872.34 | +$27.82 |
Six consecutive short (sell) positions opened across a 13-day window as gold was rising. All six held open simultaneously with zero stop-losses (SL = 0.00 on every position). All six closed at exactly the same price ($2,872.34) on the same date — February 27, 2025 — when gold finally reversed and moved in the system’s favor.
Read that again: no stop-losses on any of the six positions. Six open trades, all short, all underwater simultaneously when gold was at $2,900+. The total unrealized floating loss at the peak of gold’s February 2025 move — when gold was near $2,930 and all six short positions were open — was the source of that $440 equity drawdown.
The final net result on these six trades was: -$39.24 + (-$11.25) + $8.77 + $45.71 + $65.83 + $27.82 = +$97.64. The system survived because gold happened to reverse. But had gold continued higher — as it did for most of 2024 and 2025 — this cluster of six uncapped short positions would have produced a catastrophic, potentially account-ending loss.
This is not a multi-strategy algorithm selecting the optimal approach based on market regime detection. This is an averaging-down system opening multiple positions in the same direction without stop-losses, betting on a reversal that may or may not come.
The No-Stop-Loss Architecture: A Professional Assessment
In professional algorithmic trading, operating without stop-losses on accumulating positions is not a strategy choice — it is a capital destruction mechanism that is simply waiting for the right adverse event. Here is why.
Every averaging-down system has a theoretical justification: if you open multiple positions at progressively worse prices in the same direction, eventually the market must reverse, and your weighted average entry will be profitable. This logic has two fatal flaws.
Flaw 1: Markets can trend for much longer than any averaging system can survive. Gold moved from approximately $1,800 to $3,000+ between 2022 and early 2025. An averaging-down short system operating throughout this period would have accumulated losses that no reasonable account size could absorb. The fact that the backtest survived the February 2025 episode is a function of the timing of the reversal — not a function of strategy robustness.
Flaw 2: The risk is unlimited and unmanaged. A standard stop-loss defines maximum risk per trade in advance. Without stop-losses, the maximum risk per open position is, in theory, unlimited — bounded only by margin and broker stop-out levels. When six such positions are open simultaneously, the effective risk multiplies. In the February 2025 scenario, at 0.01 lot, the risk was limited by account size. At 0.1 lot, the $440 equity drawdown would have been $4,400 on a $10,000 account. At standard 1.0 lot, it would have been $44,000.
The system at 0.01 lot looks survivable in the backtest. The system at higher lot sizes, with the same logic, would have blown many accounts entirely.
Compound Effect = True: What This Parameter Actually Does
One of the most important parameters in the Gold Zilla AI EA backtest is: compound_effect=true. This setting is described as enabling compounding — theoretically scaling position sizes as the account grows.
However, examination of all 563 trades in the backtest shows that every single trade used exactly 0.01 lot throughout the entire 6.4-year test period. Compound growth is not reflected in any trade in the data.
This means one of two things:
- The compound effect did not activate in the test because the risk level (risk_level=1) was insufficient to trigger lot scaling above the fixed_lot=0.01 floor — meaning the balance growth was never large enough to generate even 0.02 lots.
- The compounding logic functions differently than described, and fixed_lot=0.01 overrides it regardless of the compound_effect parameter.
In either case, the implication for live trading is critical: any trader who activates this EA with a higher risk level expecting the “compound effect” to generate accelerating growth will likely experience position sizes that scale up significantly — including during averaging-down sequences like the February 2025 cluster. What produced a $440 equity drawdown at 0.01 lot would produce dramatically larger drawdowns at scaled lot sizes.
The Trades by Time Distribution: A 5-Minute Scalper in Reality
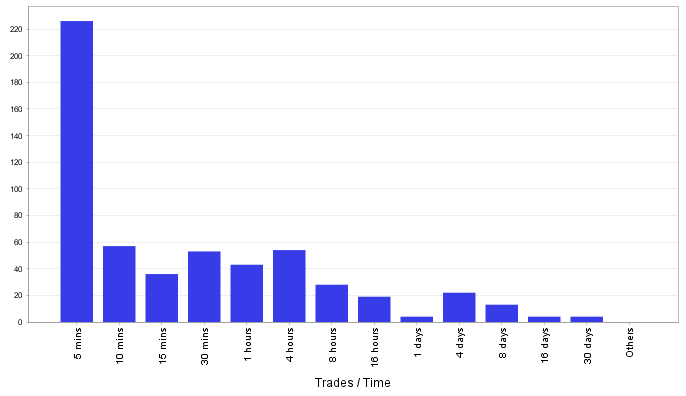
The Trades by Time histogram reveals the actual character of this system. The dominant holding period category is under 5 minutes — with approximately 225 trades closing within that window. This dwarfs every other category. The 10-minute, 30-minute, and 4-hour buckets are secondary.
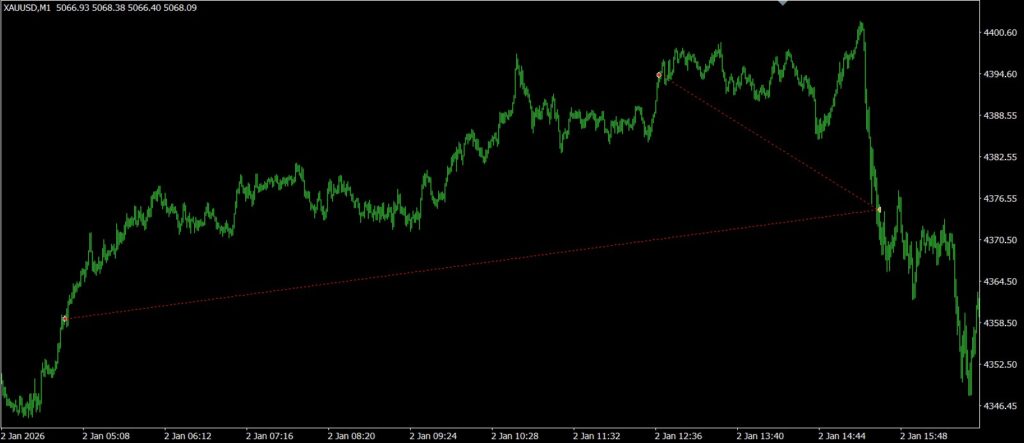
The average trade holding time from the raw data is 12.1 hours — dramatically skewed by the small number of multi-day positions (43 trades held longer than 24 hours). Without those outliers, the median holding time is well under 1 hour.
This reveals a dual-mode operation: the system primarily operates as an ultra-short-term M1 scalper, collecting tiny profits (average winning trade: $2.30) through rapid entry and exit. But embedded within this scalping logic is a secondary behavior that occasionally activates and holds positions for days or weeks with no stop-loss protection.
The M1 scalping component is responsible for the visual smoothness of the equity curve. The multi-day averaging component is responsible for both the biggest winners and the most dangerous exposure in the entire backtest.
Win/Loss by Hour: Active During the Right Hours, Vulnerable at the Wrong Moments
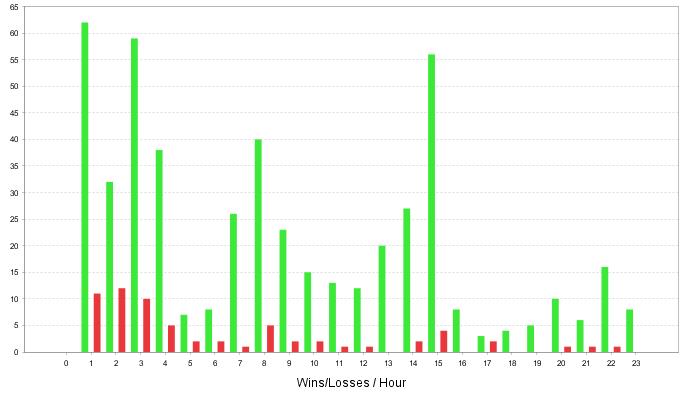
The Win/Loss by Hour chart shows the EA is most active during hours 0–3 UTC (Asian session open) and hours 7–9 UTC (European session), with another cluster at hour 15 UTC (New York afternoon session). Loss trades are distributed across the same windows.
The concentration of activity in the Asian session open is worth examining specifically in the context of XAUUSD. Hours 0–3 UTC are characterized by lower liquidity, wider spreads relative to European hours, and susceptibility to sudden directional spikes from overnight news flow. For a scalper with 5-minute average holding times and no stop-losses on averaging positions, this session window creates meaningful execution risk.
The absence of a news filter in the parameter set (NewsFilter does not appear in the extracted parameters) compounds this risk. An M1 scalper without news filtering is exposed to FOMC, NFP, CPI, and geopolitical events — precisely the conditions that generate 200+ point instantaneous moves in gold and would extend averaging-down sequences dramatically.
The Risk-Reward Reality: The Math Behind the Numbers
The aggregate statistics look reasonable: profit factor 3.33, average profit of $2.30 versus average loss of $5.90. The actual risk-reward per trade is approximately 2.6:1 in the wrong direction — you win $2.30 when right and lose $5.90 when wrong. The 89.52% win rate compensates.
But the sensitivity calculation is sobering. The expected payoff per trade is:
E = (0.8952 × $2.30) + (0.1048 × -$5.90) = $2.06 − $0.62 = $1.44
That matches the reported expected payoff. Now let’s test sensitivity:
| Win Rate | Expected Payoff |
|---|---|
| 89.52% (backtest) | $1.44 |
| 85% | $0.07 |
| 83% | -$0.28 |
| 80% | -$0.66 |
At 85% win rate, the system generates barely $0.07 per trade — effectively breakeven. At 83%, it becomes a losing system. For an M1 scalper operating in 2025–2026 gold market conditions with elevated volatility, spread expansion during active hours, and slippage on rapid entries and exits, a 4–6 percentage point decline in win rate from backtest levels is entirely realistic.
The more important concern is the outlier loss structure. With no stop-losses on averaging sequences, the average loss of $5.90 is not the ceiling — it is the average across 59 loss trades, most of which were fast, small scalper losses. The large losses (the -$39.24, -$38.61, -$26.23) come from the multi-day averaging sequences and are fundamentally different in character from the scalper losses. Aggregating them into a single “average loss” conceals a bimodal risk distribution: small frequent scalper losses, and occasional large averaging-sequence losses.
The Yearly Breakdown: A System Accelerating Unsustainably
The year-by-year performance data extracted from the full trade log reveals an interesting pattern:
| Year | Trades | Win Rate | Net P&L | End Balance |
|---|---|---|---|---|
| 2020 | 96 | 89.6% | $84.40 | $1,084.42 |
| 2021 | 83 | 91.6% | $54.72 | $1,139.15 |
| 2022 | 82 | 86.6% | $86.63 | $1,225.77 |
| 2023 | 93 | 86.0% | $54.58 | $1,280.35 |
| 2024 | 96 | 93.8% | $95.67 | $1,376.02 |
| 2025 | 85 | 87.1% | $242.07 | $1,618.10 |
| 2026 | 28 | 96.4% | $191.81 | $1,809.92 |
Two observations demand attention here.
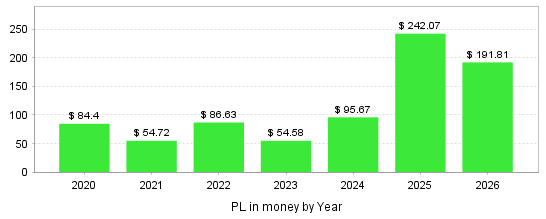
First, from 2020 through 2024, annual net profit was modest and consistent — between $54 and $96 per year at 0.01 lot. This is a slow, steady accumulation pattern consistent with conservative M1 scalping on a micro-lot basis.
Then in 2025, net profit jumps to $242 — more than 2.5× the prior annual maximum. And in just the first 3.5 months of 2026 (January to mid-April), the system generated $191 — a pace of approximately $655 annualized.
This acceleration is almost entirely due to the February 2025 averaging-down cluster. The six positions that generated the $440 equity drawdown ultimately closed for a net profit of approximately $97. They are the reason 2025 looks like an outlier year.
The 2026 data is even more striking: 28 trades, 96.4% win rate, $191 profit in 3.5 months. This is almost certainly another period of favorable market conditions for the EA’s specific positioning bias — not evidence of a structurally improved strategy.
An equity curve that looks beautiful in aggregate is constructed from periods of extreme risk (the February 2025 cluster) mixed with periods of smooth scalping. The smoothness is the scalping. The acceleration is the gambling.
“Compound Effect” in Marketing vs. Reality
The vendor marketing for Gold Zilla AI emphasizes several features that deserve factual examination:
Claim: “Multi-strategy algorithm detecting market regimes to dynamically select from five distinct strategies” Reality in the data: Only Strategies 1 and 2 are active. Strategies 3, 4, and 5 are disabled (tradeStrategy3=false, tradeStrategy4=false, tradeStrategy5=false). The “five distinct strategies” framework is incomplete even in the vendor’s own backtest configuration.
Claim: “AI-assisted” and requires an “AI API key” Reality: The parameter activated=false and apiKey="" in the backtest suggest the AI component was not active during testing. The EA can operate with the AI module disabled (or the external API not connected), which raises questions about what the AI component actually contributes to trade execution logic versus what the rule-based system does independently.
Claim: “Minimizing drawdown on XAUUSD” Reality: A 31.54% equity drawdown — nearly one-third of starting capital in unrealized losses at a single moment — is not a minimized drawdown. It is a high-risk outcome resulting from uncapped simultaneous positions without stop-losses.
Claim: “Compound_effect = true generates accelerating growth” Reality: All 563 trades in the backtest use identical 0.01 lot sizes throughout 6.4 years, regardless of account balance doubling from $1,000 to $1,800+. The compound effect either did not activate or is overridden by the fixed_lot parameter.
Live Signal Disabled: What It Means for Due Diligence
The disabled MQL5 signal is not merely an inconvenience for the Gold Zilla AI EA review process — it is a structural due diligence failure for any prospective buyer.
When a developer sells an EA based on demonstrated live performance, and the live signal is disabled, the buyer has no way to independently verify:
- Whether the strategy generated real profits in live conditions
- Whether the live account experienced the same drawdown patterns seen in the backtest
- Whether the account was closed due to poor performance or other reasons
- What the peak-to-trough drawdown on the live account was
The MT5 version of Gold Zilla AI was published on MQL5 on March 26, 2026, making it a very new product. The MT4 version has the disabled signal from a separate earlier account. The reviews on the MT5 page are from the first week of April 2026 — less than two weeks after publication. These are not meaningful performance validation points for a strategy intended to operate across multiple market cycles.
One reviewer on the MT5 product page specifically noted: “After two months, following a series of wins and losses, I’m back to square one — no gains and no profit.” This was about a related product from the same developer — but it reflects the general pattern of systems that work briefly in favorable conditions and then stall.
Why M1 Gold Scalping Is Structurally Difficult
Understanding the broader context for M1 XAUUSD trading is essential for any honest Gold Zilla AI EA review. Trading gold on the 1-minute timeframe creates a specific set of structural challenges that elevate the risk profile beyond what aggregate backtest statistics reveal.
Spread impact is amplified on M1. At 0.01 lot with an average profit of $2.30, every 0.1-pip increase in effective spread represents a 4.3% increase in cost per trade. ICMarkets may offer 0.1-pip XAUUSD spreads during liquid hours, but M1 scalping occurs across all hours, including Asian session thinning and news-related widenings. A consistent 0.2-0.3 pip additional spread over the ICMarkets test conditions would substantially reduce the already thin per-trade margins.
Slippage on M1 is unpredictable. The test uses slp1=0.5 — a minimal slippage assumption. In live M1 scalping, particularly around news events and session transitions, slippage of multiple pips on entry and exit is common. On trades with $2.30 average profit targets, slippage of even 0.5 pip represents a 21% degradation in profit expectancy.
The averaging-down sequence on M1 is especially dangerous. When positions are opened every few days on M1, the system is using very short-term price data to identify entries — but then holding positions for weeks. These are fundamentally incompatible timeframes. M1 signals are valid for minutes to hours. Holding M1-initiated positions for 23 days, as occurred in February 2025, means the original entry logic is long since irrelevant. The position is being held purely in expectation of a reversal.
The Overfitting Risk: Six Years of a Gold Bull Market
The test period — January 2020 to April 2026 — coincides almost entirely with one of gold’s strongest bull markets in modern history. From approximately $1,500 in early 2020 to $3,000+ by 2026, gold experienced a sustained, multi-year directional move interrupted by periodic corrections.
An averaging-down short system operating in this environment faces the following asymmetry: when gold corrects (pulls back during the bull market), short positions profit quickly and close cleanly. When gold continues upward, the system opens more shorts, accumulates losses, and eventually closes when gold reverses back to the initial entry zone. The February 2025 episode is the archetypal example.
In a sustained bear market for gold — or a prolonged flat range with sharp upward spikes — the same logic would produce a different outcome: positions accumulating underwater for months, not weeks, with no guarantee of a reversal to the entry levels.
The 2020–2026 gold market was perhaps the most favorable possible environment for this type of averaging strategy to survive. The backtest does not tell us how the system performs in gold market regimes that are genuinely unfavorable for this approach.
Gold Zilla AI EA Review: Professional Pre-Use Checklist
If you are seriously considering deploying this EA, here is the checklist:
1. Demand a verifiable live account history before any capital commitment. The disabled MQL5 signal is a fundamental information gap. Any serious evaluation requires live trade-by-trade data from a running, not historical, account. “First week reviews” from days after publication are not performance validation.
2. Never run this EA without understanding the no-stop-loss architecture. The February 2025 sequence proves that this system will open multiple positions without stop-losses and hold them for weeks if its internal logic calls for it. Your broker’s margin stop-out level is your only hard protection. Calculate the maximum adverse excursion you are willing to tolerate before the first trade is opened.
3. Test the compound_effect at your intended risk level before live deployment. If you intend to use risk_level > 1, backtest the specific behavior at that level to understand whether lot sizes scale during averaging sequences. A sequence like February 2025 at 0.1 lot would generate a $4,400+ equity drawdown on a $10,000 account — a 44% equity hit that would stop out most brokers’ margin systems.
4. Do not run Strategies 3, 4, and 5 without extensive forward testing. The backtest only validated Strategies 1 and 2. The behavior of the other three strategies in live conditions is entirely untested by the available evidence.
5. Confirm the AI API connection status before live trading. With activated=false in the backtest, the AI module was not verified as contributing to the tested results. Ensure you understand whether the API connection is required, optional, or irrelevant to actual trade execution.
6. Run with the lowest viable position size for at least 3 months. 0.01 lot is the appropriate starting point regardless of account size. The system’s risk profile — including the possibility of multi-week averaging sequences — requires live observation before any capital scaling.
7. Set independent broker stop-loss alerts for open position equity. Without internal stop-losses, you need an external circuit breaker. Set equity alerts at 15% and 25% drawdown levels and define in advance what you will do if those levels are reached.
Final Verdict: Gold Zilla AI EA Review Without the Spin
The Gold Zilla AI EA is a technically competent M1 scalping system with several genuine positives: a rigorous backtest methodology using third-party tick data, a positive profit factor, and a consistent win rate over 6+ years. For traders who want a fully automated XAUUSD system on M1, those qualities are worth acknowledging.
But the honest assessment cannot stop there.
The system operates without stop-losses on its most dangerous trades. It opened six simultaneous short positions in February 2025 as gold was near all-time highs, held them for up to 23 days with no predefined exit, and produced a 31.54% equity drawdown at 0.01 lot that was ultimately rescued by a market reversal. Had gold continued higher — a historically plausible scenario — the outcome would have been account-threatening.
The live signal is disabled with no explanation and no replacement. The compound effect parameter is listed as true but did not produce scaling lot sizes throughout the entire backtest. Three of five strategies are untested. The AI API component was deactivated during the backtest. The marketing language describes features that the underlying evidence does not confirm.
For beginner traders: an EA operating on 1-minute gold without stop-losses is not a low-risk automation tool, regardless of how smoothly the equity curve rises. The equity curve looks smooth because the large risks are hidden in the gap between balance and equity. Learn to read the difference.
For intermediate traders: the February 2025 trade cluster tells you everything about this system’s actual operating logic. Multi-day, multi-position, no-stop-loss, same-direction sequences are averaging-down behavior regardless of what label is applied to them. Price accordingly.
For experienced algorithmic traders: the parameter block says everything. No stop-losses, compound_effect=true with fixed_lot=0.01, apiKey=”” (AI inactive), and tradeStrategy1 and 2 only active. The beautiful equity curve is built on 504 micro-lot scalp wins averaging $2.30 each, punctuated by averaging sequences that generate both the largest profits and the largest unrealized drawdowns. Walk-forward validation on a genuinely out-of-sample period — 2026 onward, real market conditions — is the only meaningful test.
The disabled live signal is not a detail. It is the conclusion.
Trade with your eyes open.
Even more advisors with test results are presented in our advisor database.
In order to download an adviser with tests, go to our telegram channel 👇