


Key Takeaways
- In the USDJPY M5 test covering 2015–2023, Merit EA produced $10,375.52 in net profit from a $1,000 initial deposit, with a Profit Factor of 1.28 across 6,126 trades.
- The reported 5.49% Maximal Drawdown does not describe the full percentage risk: the same MT4 report also shows a 37.48% Relative Drawdown.
- All 6,126 entries used a fixed 0.10 lot size, with no observed increase in position volume.
- The parameters expose five named trading logics, while the trade history shows up to five positions open at the same time.
- Both long and short trades were profitable, although the long side contributed materially more profit.
- A substantial share of positions remained open for hours, and the groups held for eight hours or longer produced negative aggregate P/L. The label “scalper” therefore describes Merit only partially.
- The Monte Carlo analysis used 500 simulations, the Resampling method, and a 1% probability of skipping trades. At the 95% confidence level, the Net Profit estimate declines to about $7,461, while the Max Drawdown estimate rises to about $989.
Merit EA Test Setup
We tested one Merit EA configuration on USDJPY M5.
| Parameter | Value |
|---|---|
| Expert Advisor | Merit EA (Merit_USDJPY_M5_V1_FE_fix) |
| Platform | MetaTrader 4, ICMarketsSC-Demo06, Build 1380 |
| Symbol / Timeframe | USDJPY, M5 |
| Test Period | 7 January 2015 – 22 September 2023 |
| Model | Every tick |
| Modelling Quality | 99.90%, 0 mismatched chart errors |
| Tick Data | Dukascopy via Tick Data Suite v2 |
| Time Zone | GMT+2, US DST |
| Spread | Variable historical spread |
| Commission and Swaps | Configured from the IC Markets account parameters in MT4 |
| Initial Deposit | $1,000 |
The MT4 report records the symbol, test period, server, build, modelling method, modelling quality, variable spread, initial deposit, and EA parameters. The test used Dukascopy tick data through Tick Data Suite v2, with GMT+2 and US daylight-saving time. Commission and swaps were configured according to the IC Markets account parameters in MT4.
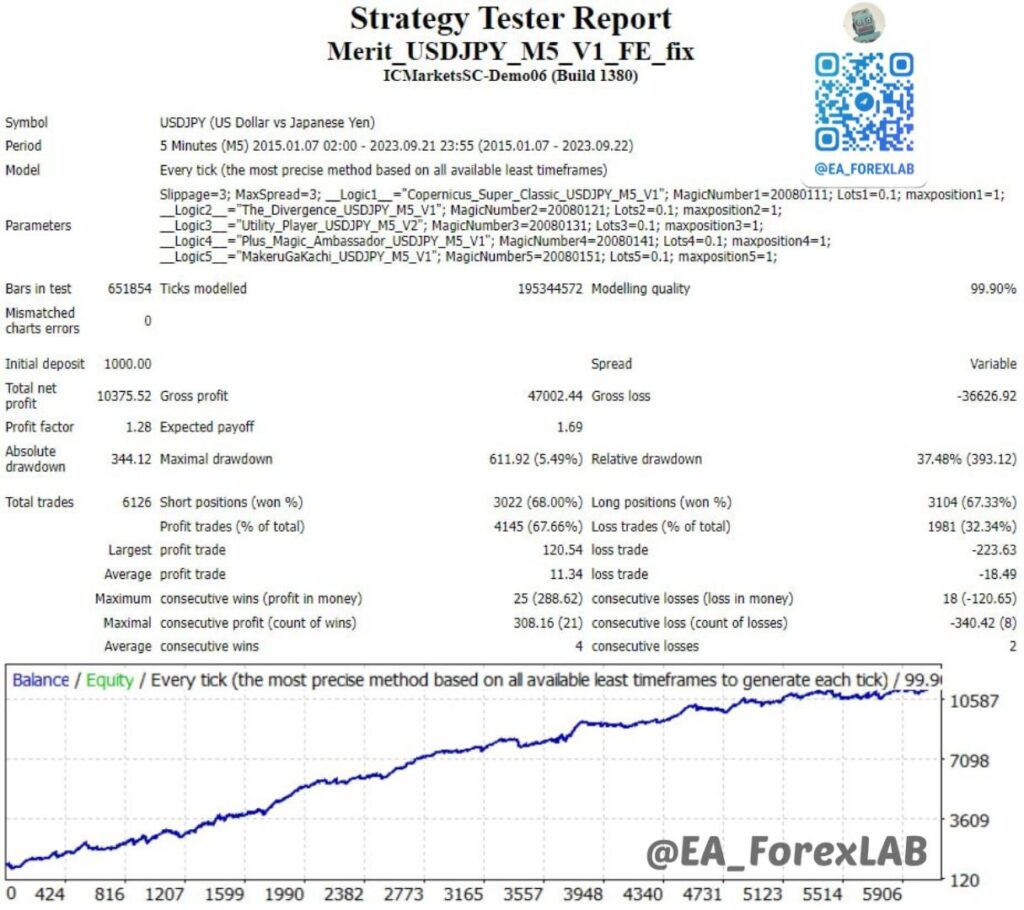
MT4 Strategy Tester report for Merit EA on USDJPY M5, covering January 2015 to September 2023, with 6,126 trades and a 37.48% relative drawdown.
Our approach to testing and interpreting Expert Advisors is explained in the EA ForexLab testing methodology. The EA, original Strategy Tester HTML report, and related test files are available in the EA ForexLab archive.
Core Backtest Results
| Metric | Result |
|---|---|
| Net Profit | $10,375.52 |
| Gross Profit | $47,002.44 |
| Gross Loss | -$36,626.92 |
| Profit Factor | 1.28 |
| Expected Payoff | $1.69 |
| Absolute Drawdown | $344.12 |
| Maximal Drawdown | $611.92 (5.49%) |
| Relative Drawdown | 37.48% ($393.12) |
| Total Trades | 6,126 |
| Winning Trades | 4,145 (67.66%) |
| Average Winning Trade | $11.34 |
| Average Losing Trade | -$18.49 |
| Largest Winning Trade | $120.54 |
| Largest Losing Trade | -$223.63 |
A Profit Factor of 1.28 is positive, but the margin of advantage is not large. The average losing trade, at $18.49, was approximately 1.63 times larger than the average winning trade of $11.34. Based only on these two averages, Merit would need a win rate of roughly 62% to break even; the test produced 67.66% winning trades.
This is a descriptive approximation based on the trades already recorded under the tested conditions, including variable spread, commission, and swaps from the IC Markets account setup. It does not show how performance would change under a different cost structure or with additional market slippage.

QuantAnalyzer equity and drawdown chart for Merit EA, showing account growth across the 2015–2023 USDJPY M5 test.
The test also contained extended losing sequences. The longest run reached 18 consecutive losing trades, while Maximal Consecutive Loss was −$340.42. Average streaks were shorter, at approximately four winning trades or two losing trades.
Why the $10,375 Profit Requires Fixed-Lot Context
All 6,126 entries used a fixed volume of 0.10 lot. The trade history shows no increase in position size. The result should therefore not be interpreted as growth achieved with a constant percentage risk model or as conventional compounding.
As the account grew, the same 0.10-lot position represented progressively smaller nominal exposure relative to the account balance. For otherwise comparable trades, that would normally reduce percentage exposure, although the exact risk still depends on stop-loss distance and the logic of the relevant module. Percentage results from the early and late parts of this fixed-lot test are therefore not directly comparable: the same dollar change has a very different impact on a $1,000 account than on a $10,000 account.
Drawdown: 5.49% or 37.48%?
The MT4 report shows two different drawdown measures:
- Maximal Drawdown: $611.92 (5.49%)
- Relative Drawdown: 37.48% ($393.12)
The relationship between the dollar amount and percentage indicates that the $393.12 decline at 37.48% occurred when the account level was close to approximately $1,050, whereas the $611.92 decline at 5.49% occurred at a much higher account level. In other words, the deepest percentage decline happened while the account remained close to its initial size, while the largest dollar decline occurred later, after the account had grown.
Neither figure is incorrect: they describe different aspects of the account path. However, risk should not be judged from the 5.49% figure alone. At one point, the decline exceeded one third of the account value at that stage of the test.
Five Trading Logics and Aggregate Exposure
The test parameters expose five modules, each with its own MagicNumber and maxposition=1:
Copernicus_Super_Classic_USDJPY_M5_V1— MagicNumber 20080111The_Divergence_USDJPY_M5_V1— MagicNumber 20080121Utility_Player_USDJPY_M5_V2— MagicNumber 20080131Plus_Magic_Ambassador_USDJPY_M5_V1— MagicNumber 20080141MakeruGaKachi_USDJPY_M5_V1— MagicNumber 20080151
The trade history shows a maximum of five positions open simultaneously. Combined with five modules and maxposition=1, this is consistent with several logics being active at the same time, although the standard report does not reliably map every individual position to a specific MagicNumber.
Each position used 0.10 lot, so the maximum observed aggregate open exposure was approximately 0.50 lot. Merit is therefore better described as a multi-module USDJPY EA with five named trading logics than as a single algorithm using only one entry model.
No classic martingale-style lot escalation was observed in this configuration: every recorded entry used a fixed 0.10-lot volume. Because the source code is closed, the internal rules of each module cannot be fully reconstructed. The structure resembles a set of sub-logics operating on one instrument, but it should not automatically be treated as a diversified portfolio because all modules trade USDJPY and may react to the same market movements.
Long and Short Trades Were Both Profitable
We separated the trades by direction and analysed them in QuantAnalyzer. The figures below are an analytical decomposition and may differ slightly from the headline MT4 totals.

QuantAnalyzer comparison of Merit EA results by trade direction, with both long and short trades profitable and long trades contributing more net profit.
| Direction | Trades | Win Rate | Net P/L | Profit Factor |
|---|---|---|---|---|
| Long | 3,104 | 67.33% | ≈ +$6,440 | ≈ 1.36 |
| Short | 3,022 | 68.00% | ≈ +$3,932 | ≈ 1.21 |
Both directions ended the test period in profit. The number of long and short trades was almost equal, but long trades generated a larger share of the total profit and a better ratio of aggregate profit to aggregate loss. This reduces dependence on a single direction within the tested sample, although it does not guarantee that the same balance will persist under a different market regime.
Trade Duration: Is Merit Only a Scalper?
The holding-time distribution shows that a substantial share of positions remained open for hours rather than minutes. The most populated groups fall broadly between one and sixteen hours, particularly around the four-hour and eight-hour intervals. Some positions remained open for several days.


Merit EA aggregate profit and loss grouped by holding duration
When aggregate P/L is grouped by holding duration:
- the intervals from approximately 10 minutes to 4 hours produced positive aggregate results;
- the 5-minute group was negative;
- the groups held for 8 hours or longer produced negative aggregate P/L;
- the approximately 16-hour group was the weakest.
These figures show aggregate profit and loss by duration group, not the frequency of losing trades inside each group. They do not establish a universal rule such as “close every trade after eight hours,” but they do show that extended holding periods were the weaker part of this test.

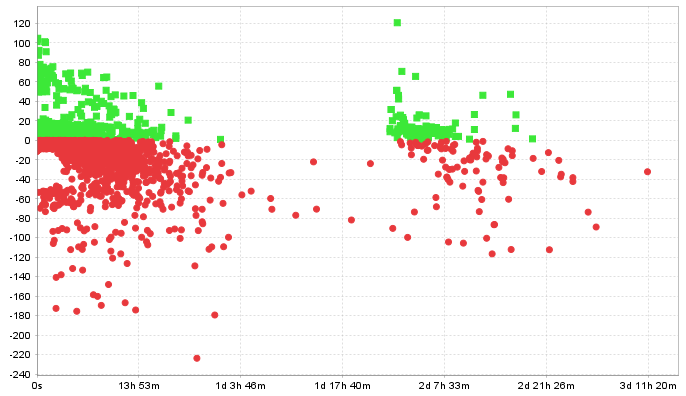
Merit EA trade-pattern analysis by entry hour and holding time: activity varied across the day, while larger losses extended further than winning outcomes in the duration scatter.
Based on holding duration alone, Merit has a broader profile than a conventional short-term scalper. The report does not reveal the decision rules of each module, so the EA cannot be definitively classified as a swing-trading system.
How Performance Was Distributed by Year
To examine consistency across periods, we grouped trades by closing year. The figures are rounded, so their sum may differ slightly from the MT4 headline Net Profit. The 2023 period is incomplete.
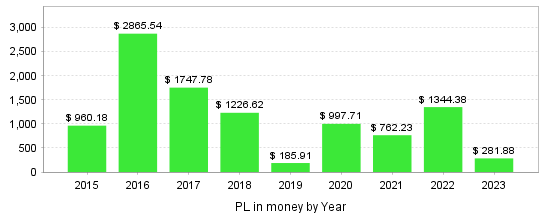
Yearly Merit EA results for the USDJPY M5 backtest: every displayed calendar segment was profitable, with 2016 producing the strongest result and 2023 covering a partial period.
| Year | P/L |
|---|---|
| 2015 | +$960 |
| 2016 | +$2,866 |
| 2017 | +$1,748 |
| 2018 | +$1,227 |
| 2019 | +$210 |
| 2020 | +$974 |
| 2021 | +$762 |
| 2022 | +$1,344 |
| 2023 (partial) | +$282 |
Every calendar segment shown in the test was profitable, although the size of the result varied considerably. The strongest year was 2016, which contributed approximately 28% of the trade-level P/L. It did not account for most of the total profit, however: positive results were distributed across several years. The weakest periods were 2019 and the partial 2023 segment.
Monte Carlo: How Does the Range of Simulated Outcomes Change?
A single backtest curve represents only one realised sequence of trades. Monte Carlo analysis uses the trade history as its source and generates many alternative paths by applying random changes according to the selected configuration.
For Merit EA, we used:
- 500 simulations;
- Randomize trades order with Resampling method;
- the Resampling method;
- Randomly skip trades with 1% probability.
Resampling creates alternative sequences from the original trade history, while the 1% trade-skipping setting additionally tests sensitivity to incomplete execution of trading signals. The simulations can therefore change not only the order of trades, but also their composition, trade count, Net Profit, and Drawdown.
The Monte Carlo methodology is explained in more detail by StrategyQuant.
How to Read the 95% Confidence Level
The 95% row contains conservative percentile estimates for individual metrics under the selected Monte Carlo settings. For Net Profit, it is a lower estimate; for Drawdown, it is an upper estimate. Values in the same row do not necessarily belong to one identical simulated path. This is a reference point within the model, not a 95% probability of a future live-trading result.

QuantAnalyzer Monte Carlo results for Merit EA: at the 95% confidence level, estimated net profit falls to about $7,461 while maximum drawdown rises to about $989.
Merit EA Monte Carlo Results
MT4 and QuantAnalyzer drawdown metrics must be kept separate. QuantAnalyzer constructs its own account curve from the imported trade history, so the original 4.04% Max % Drawdown should be compared only with the Monte Carlo results calculated inside QuantAnalyzer. It does not replace, and should not be directly compared with, the 37.48% Relative Drawdown reported by MT4.
| Metric | QA Original | 95% Monte Carlo |
|---|---|---|
| Net Profit | $10,372.23 | $7,461 |
| Max Drawdown | $548.57 | $989.24 |
| Max % Drawdown | 4.04% | 7.31% |
| Ret/DD | 18.91 | 8.42 |
| Number of Trades | 6,126 | 6,054 |
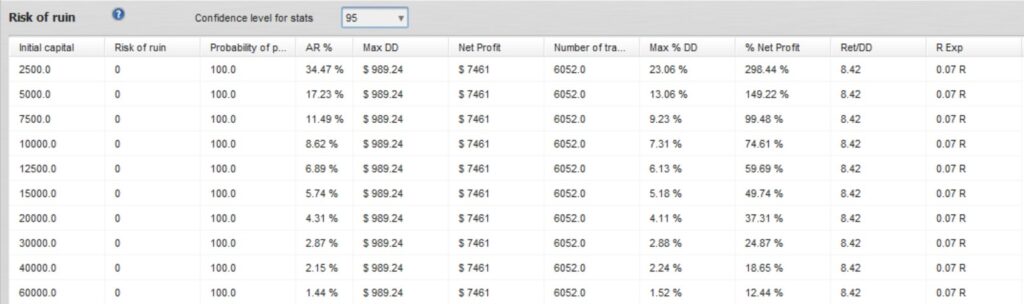
QuantAnalyzer risk-of-ruin analysis for Merit EA at the 95% confidence level, reporting 0% modelled risk of ruin across the displayed initial-capital values under the selected assumptions.
Relative to the original QuantAnalyzer calculation, at the 95% confidence level:
- the Net Profit estimate is approximately 28% lower;
- the Max Drawdown estimate is approximately 80% higher;
- the Max % Drawdown estimate is approximately 81% higher;
- Ret/DD declines from 18.91 to 8.42, a reduction of approximately 55%.
These values should be read separately. At the 95% confidence level, the lower Net Profit estimate remains positive at approximately $7,461, while the conservative Max Drawdown estimate rises to about $989. The table shows a gradual deterioration as the confidence level increases: the profit estimate declines while the drawdown estimate rises.
The result answers the question defined by this specific configuration: how the statistics change when the original trade history is resampled and approximately 1% of trades are randomly excluded. It does not test different EA parameters, another market, different spread or commission assumptions, additional market slippage, or a future market regime.
Trading Costs and EA ForexLab Rebate
With 6,126 trades, a Profit Factor of 1.28, and an Expected Payoff of $1.69, the result is sensitive to execution conditions. Gross Profit of $47,002 and Gross Loss of $36,627 are both much larger than the $10,375 net result, so even a relatively small change in cost per trade can materially affect the final outcome.
The test included variable historical spread, together with commission and swaps configured from the IC Markets account parameters in MT4. Market slippage was not modelled separately. The EA input Slippage=3 is an execution setting and does not by itself prove that actual historical market slippage was simulated.

EA ForexLab Rebate calculator showing an estimated monthly rebate based on IC Markets trading volume.
EA ForexLab Rebate can reduce eligible effective trading costs where a rebate is available, but it does not change the strategy logic, remove drawdown, or turn a weak system into a robust one.
Limitations
- This is an MT4 backtest, not verified live-trading performance.
- The analysis covers one instrument and one configuration.
- The trading conditions reflect the IC Markets account parameters used in the test and may differ with another broker or account type.
- Variable spread, commission, and swaps were included; market slippage was not modelled separately.
- The internal rules of the five trading logics are unavailable because the source code is closed.
- The Monte Carlo analysis used 500 simulations with Resampling and a 1% probability of skipping trades; other perturbation methods could produce a different distribution.
- QuantAnalyzer metrics should be compared within QuantAnalyzer because its account-curve reconstruction and drawdown calculations differ from the MT4 report.
- Backtest and Monte Carlo results do not guarantee future profitability.
What the Results Show
Merit EA produced a positive historical result on USDJPY. Every yearly segment was profitable, and both long and short trades contributed positively. The headline figures still require context. Account growth was achieved with a fixed 0.10-lot volume, so nominal exposure relative to capital declined as the balance increased. The 5.49% Maximal Drawdown exists alongside a 37.48% Relative Drawdown, which materially changes the interpretation of early-period risk.
The parameters expose five named trading logics, while the trade history shows up to five positions open simultaneously. The duration analysis indicates that many trades remained open for hours, and the groups held for eight hours or longer produced negative aggregate results.
The Monte Carlo analysis, using 500 simulations, Resampling, and a 1% probability of skipping trades, showed that less favourable modelled outcomes reduce the profit estimate and materially increase the drawdown estimate. At the 95% confidence level, the Net Profit estimate remains positive, but the Max Drawdown estimate is almost twice the original QuantAnalyzer value.
The next necessary step is testing on an independent period and through a forward test. That would show whether the observed advantage persists outside the original sample. Other tested Expert Advisors are listed in the Forex EA Database. The EA, original
Strategy Tester HTML report, and related files are available in the EA ForexLab Telegram archive.
